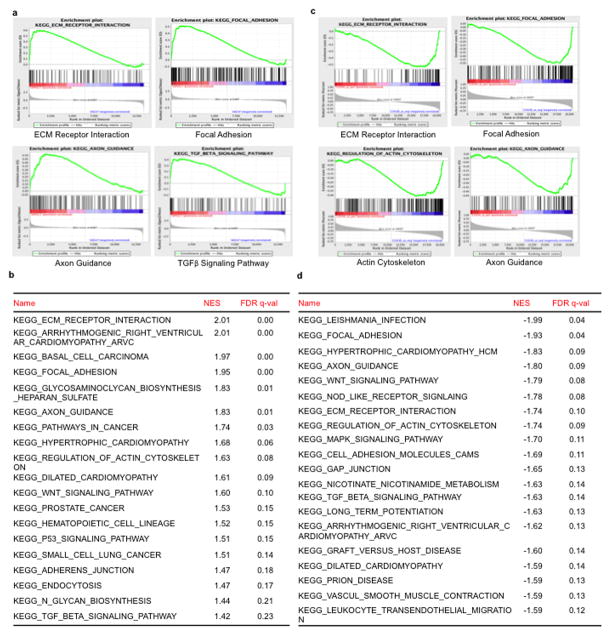
Extended Data Figure 1. GSEA analysis of PGC1α expression in melanoma cell lines.
a–b, Representative GSEA plots (a) and list of gene sets (b) enriched in A375P cells upon PGC1α knockdown from dataset GSE36879, with the significance defined by q<0.25. c–d, Plots (c) and list of (d) the top gene sets whose expression is negatively correlated with PGC1α in 61 melanoma cell lines from CCLE, with the significance defined by q<0.15.

