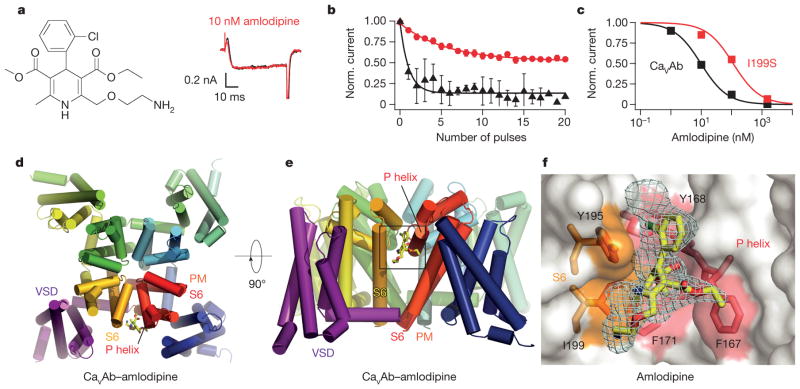
Figure 1. Structural basis for inhibition of CaVAb by amlodipine.
a, Amlodipine structure. Ba2+ currents for 0 nM (black) and 10 nM (red) amlodipine during depolarization from −120 mV to 0 mV. b, State-dependent block by amlodipine after 50-ms pulses at 1 Hz from −120 mV to 0 mV (10 nM, circles; 100 nM, triangles; mean ± s.e.m.; n = 3–5. c, Inhibition by amlodipine. Data were fit by the Hill equation with nH = 1. CaVAb: IC50 = 10 ± 0.4 nM; CaVAb I199S: IC50 = 112 ± 10 nM; n = 3–5; mean ± s.e.m. d, Structure of CaVAb (top view in cylinders) binding amlodipine (yellow sticks). PM, pore module; VSD, voltage-sensing domain. e, CaVAb with bound amlodipine in side view. f, Dihydropyridine-binding pocket of CaVAb with the Fo–Fc electron density map (2.5σ, cyan) and amlodipine (yellow sticks). CaVAb residues contacted by amlodipine are highlighted in colours and labelled.

