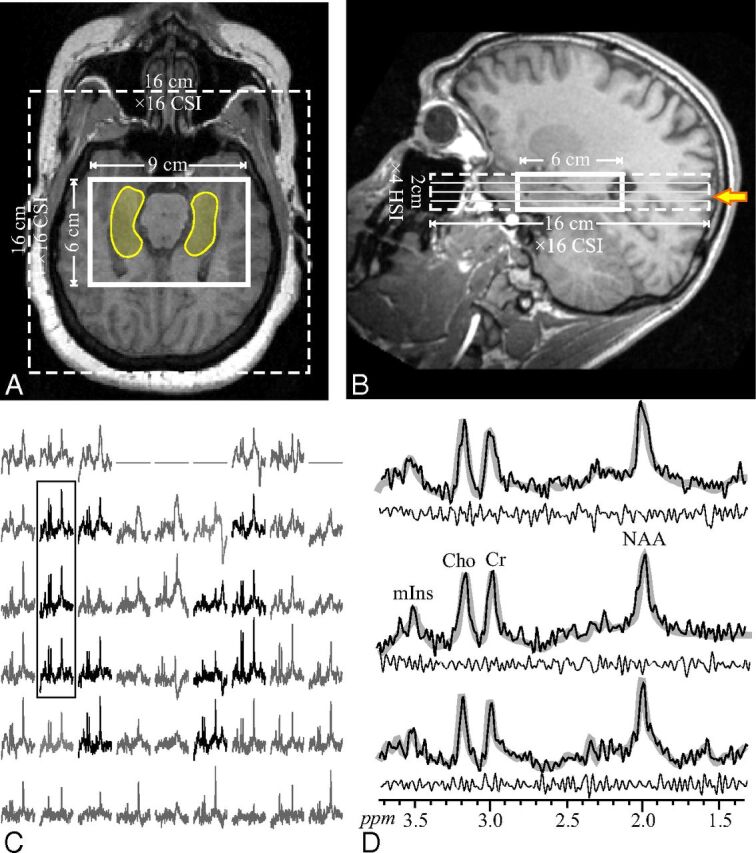
Fig 1.

Upper: Axial (A) and sagittal (B) T1-weighted MR imaging from a 23-year-old male patient (17 in Table 1) superimposed on the 9 × 6 × 2 cm3 (left-right × anteroposterior × inferior-superior) VOI, 16 × 16 cm2 axial CSI FOV (solid and dashed lines), and the hippocampal outline (transparent yellow on A). The yellow arrow in B indicates the level of A, C, and D. Lower left: C, Real part of the 9 × 6 axial (left-right × anteroposterior) 1H spectra matrix from the VOI section shown in A and marked with the solid yellow arrow on B. Spectra within the hippocampus in A are black, while the remaining ones (not included in the analyses) are gray. All are on a common frequency (parts per million) and intensity scale. The 3 spectra in the black frame over the right hippocampus are expanded on the right (D) for greater detail. Note that the hippocampi do not include voxels at the edges of the VOI (that may have relative VOI chemical shift displacement); note also the good SNR and excellent spectral resolution (8.1 ± 3.0 Hz linewidth) from the high spatial resolution (0.5 cm3) voxels. Right: D, The 3 spectra from the solid frame on C (black line) overlaid on the spectral fit (thick gray lines) and the residual (experimental − fit) underneath (thin black line). Note the spectral resolution and fidelity of the fit, reflected by the residual.
