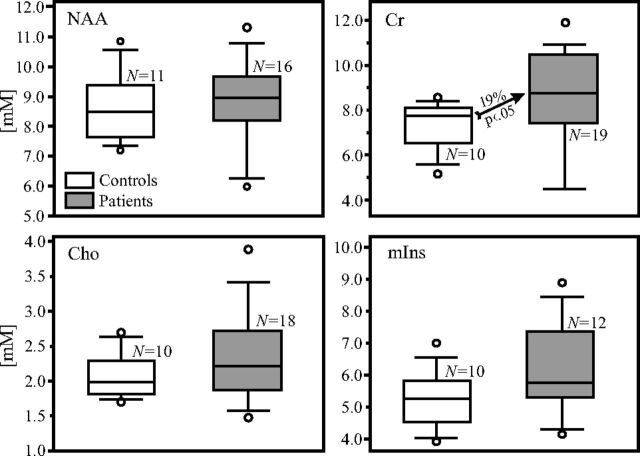
Fig 3.
Boxplots showing the first, second (median), and third quartiles; 5th and 95th percentiles (whiskers); and outliers (dots) of the distribution of the bilateral hippocampal NAA, Cr, Cho, and mIns concentrations (millimolar) in the patient (shaded) and control (white) boxes. Numbers of controls and patients included in the analyses for each metabolite, N, are listed. Note that the NAA, Cho, and mIns concentrations do not differ significantly between patients and controls (Table 2), whereas the Cr concentration is 19% higher in the bilateral hippocampi of patients than in controls (arrow).

