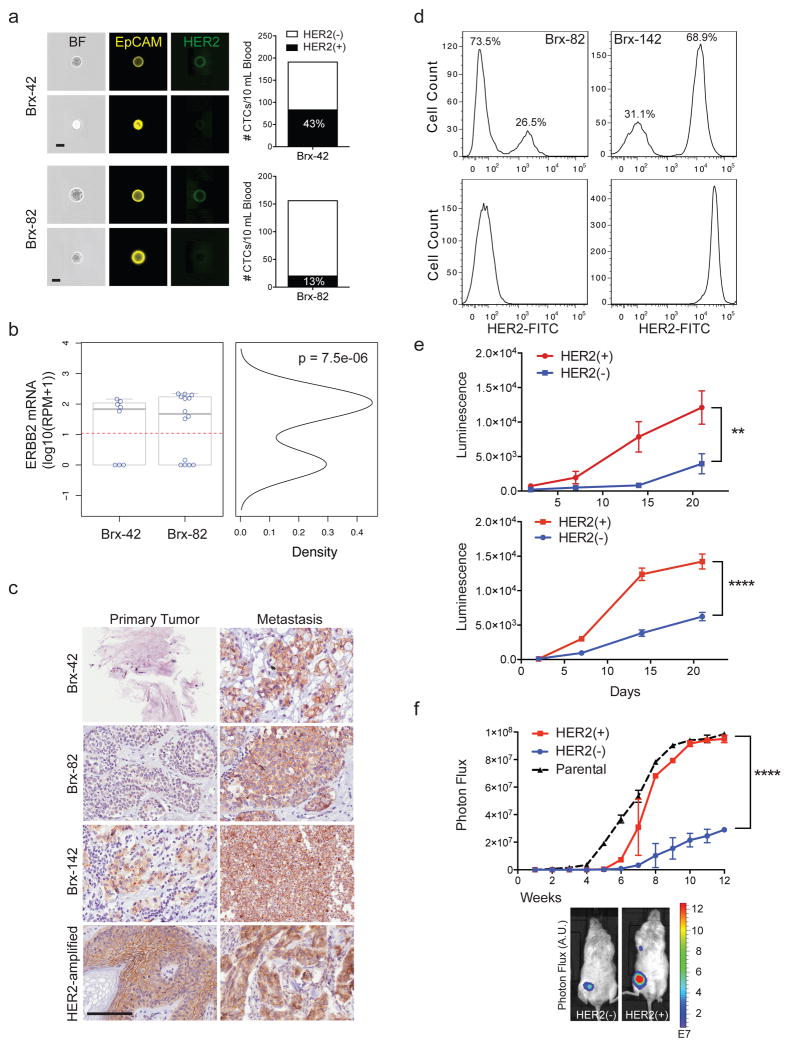
Figure 1. Distinct properties of HER2+ and HER2− CTC subpopulations from patients with advanced ER+/HER2− breast cancer.
(a) Quantitation by imaging flow cytometry of HER2+ and HER2− CTCs isolated from patients Brx-42, Brx-82. EpCAM (yellow) and HER2 (green). Scale bar: 10 μm. (b) Bimodal distribution of ERBB2 RNA-seq reads from single CTCs, Hartigans’ dip test p = 7.5e-6, n=22 (HER2− ≤ 1 read per million (RPM); HER2+ > 133, range 32–217). (c) IHC for HER2 (brown) in matched metastatic vs primary tumors (Brx-42, Brx-82, Brx-142) compared to HER2-amplified tumor (control). Scale bar: 100 μm; Tumor data (Supplemental Table 1). (d) FACS of cultured CTCs, showing discrete HER2+ and HER2− subpopulations. MDA-231 (TNBC) and SKBR3 (HER2-amplified) cells are shown as control. (e) Differential proliferation of FACS-purified HER2+ (red) and HER2− (blue) subpopulations from cultured CTCs; Two-way ANOVA p < 0.01 (Brx-82), p < 0.0001 (Brx-142); n=6; S.D. (error bar). (f) Increased in vivo growth of orthotopic mammary tumors derived from FACS-purified, HER2+ CTCs compared with HER2- cells; n=8; Two-way ANOVA p < 0.0001; S.D. (error bar).

