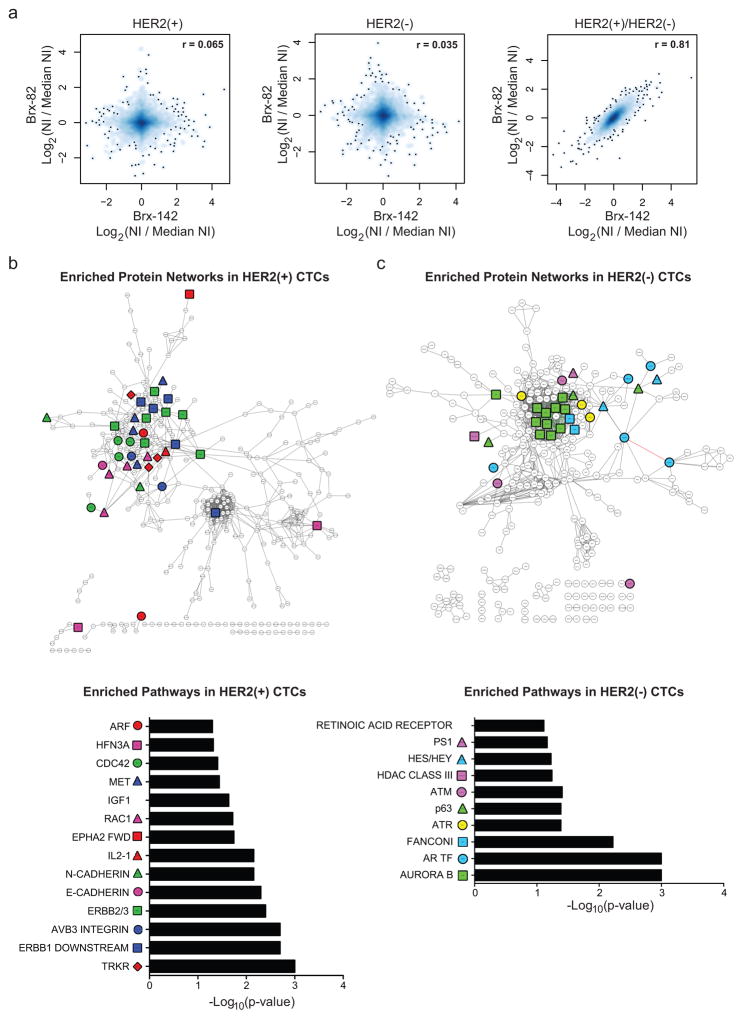
Figure 3. Molecular pathways differentially activated in HER2− versus HER2+ cultured CTCs.
(a) Comparison of quantitative MS proteomes (6349 proteins) showing distinct profiles for individual cultured CTCs (Brx-82, Brx-142), but linear correlation between proteins differentially expressed in HER2+ and HER2− subpopulations; NI = Normalized Intensity; n=2 biological replicates per CTC line Brx-42, Brx-82, Brx-142 (Supplemental Table 3). (b–c) Cytoscape network maps (upper panels) and GSEA pathway analysis (lower panels) depicting proteins enriched by greater than log2(0.5) by quantitative MS in (b) HER2+ and (c) HER2− CTCs (GSEA FDR ≤ 0.25; Nominal p-value cut-off < 0.05; Supplemental Table 4). Colored shapes represent proteins within denoted pathways. Red asterisks highlight RTK pathways in (b) and Notch pathways in (c).

