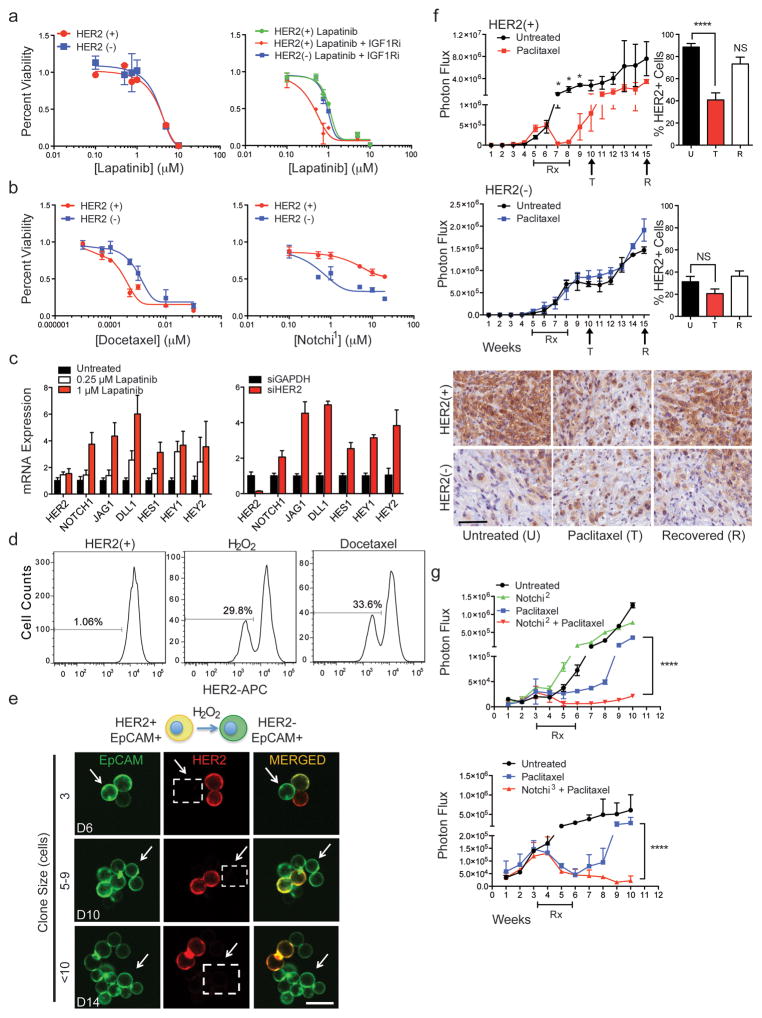
Figure 4. Cooperative targeting of HER2+ and HER2− CTC subpopulations suppresses tumor growth.
(a) HER2+ CTCs show no change in sensitivity to lapatinib alone, compared with matched HER2− CTCs (Brx-142), but have increased sensitivity to combined HER2 and IGF1R (BMS-754807) inhibitors; n=6; S.D (error bar). (b) HER2− CTCs demonstrate reduced chemosensitivity (docetaxel) but have enhanced sensitivity to Notch inhibition (BMS-708163, Notchi1), compared with HER2+ CTCs; n=6; S.D. (error bar). (c) Inhibition of HER2 with lapatinib or siRNA-mediated knockdown in HER2+ CTCs (Brx-82) results in dose-dependent increase of Notch-related genes: NOTCH1, JAG1, DLL1, HES1, HEY1, HEY2; p <0.05; n=6; S.E.M (error bar). (d) Rapid emergence (96 hrs) of HER2− CTCs following treatment of HER2+ CTCs with H2O2 (10 mM) or docetaxel (1 nM). (e) Confocal microscopy showing rapid appearance of HER2− progeny (3 cell) from single-CTC derived HER2+ colonies treated with H2O2. EpCAM (green), HER2 (red) and MERGED (gold). Scale bar: 20 μm; n=10. Arrows and dashed boxes indicate cells with loss of HER2 at indicated timepoints (D=days). (f) Paclitaxel treatment (4 weeks) of mice with CTC-derived (Brx-142) orthotopic mammary tumors. Upper panel: HER2+/HER2− tumor growth curves with paclitaxel treatment; Lower panels: Representative IHC for HER2 (brown) in HER2+ and HER2− derived tumors at the U (untreated), T (2-weeks post-treatment) and R (7-weeks post-treatment) timepoints. Scale bar: 100 μm; p-value T-test < 0.05 n=8; p-value < 0.05. (g) Simultaneous treatment (4 weeks) of mammary xenografts (Brx-82) with paclitaxel and either Notch inhibitor RO4929097 (Notchi2) or LY-411575 (Notchi3), showing sustained responses for the combination, compared with paclitaxel alone. Rx denotes treatment duration; Two-way ANOVA p-value < 0.0001 n=8.

