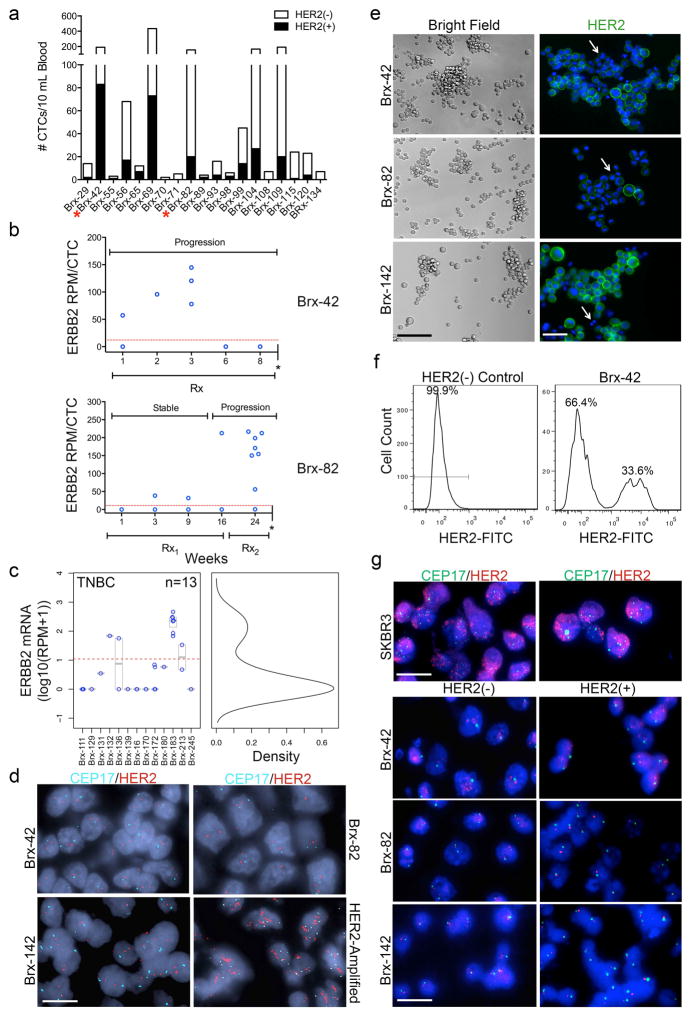
Extended Data Fig. 1. Advanced ER+/HER2− breast cancer patients harbor discrete HER2+ and HER2− subpopulations.
(a) CTCs freshly isolated from 19 ER+/HER2− breast cancer patients were stained with HER2 (yellow) and EpCAM (green) and imaged using imaging flow cytometry. Bar graph shows the number of HER2+ (black) and HER2− (white) CTCs (median 22% HER2+ CTCs, range 4–58%). Supplemental Table 1 provides HER2+/HER2− ratios and each patient’s clinical history. (b) scRNA-seq for ERBB2 expression at multiple time-points showing acquisition of HER2+ CTCs (Brx-82, Brx-42) over the course of progressive disease. Single asterisk (*) denotes patient expiration. Rx = Sacituzumab (IMMU-132); Rx1 = Vinorelbine + Trastuzumab; Rx2 = Eribulin. (c) Distinct HER2+ and HER2− CTCs from 13 TNBC patients determined by scRNA-seq (HER2− ≤ 0 read per million (RPM); HER2+ > 153, range 33–463). (d) HER2 FISH analysis of metastatic tumors from patients, Brx-42, Brx-82 and Brx-142, shows no amplification of ERBB2 compared to HER2-amplified control (Supplemental Table 1 for tumor source data). HER2 (red); chromosome enumeration probe 17 (CEP17) (cyan); Scale bar: 10 μm. Representative image from 5 independent fields are shown. (e) Bright field and IF (DAPI, blue; HER2, green) images of CTC lines, Brx-42, Brx-82 and Brx-142, demonstrate heterogeneity in HER2 expression. Scale bar: 100 μm (bright field); 20 μm (IF). Representative image from 3 independent fields are shown. (f) FACS analysis shows two distinct HER2+ and HER2− subpopulations in the CTC line Brx-42 (at initiation) compared to HER2− control. Representative data of two independent experiments are shown. (g) HER2 FISH analysis of the HER2+ and HER2− subpopulations from CTC lines Brx-42, Brx-82 and Brx-142 shows that the ERBB2 is not amplified. HER2-amplified SKBR3 cells shown as control. HER2 (red); CEP17 (green); Scale bar: 10 μm. Representative images from 5 independent fields are shown.

