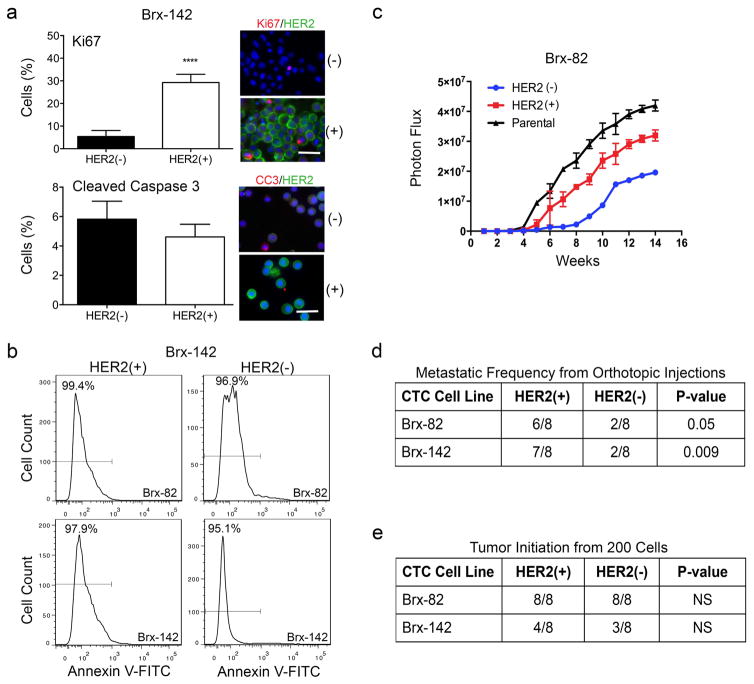
Extended Data Fig. 2. HER2+ and HER2− subpopulations exhibit distinct functional properties.
(a) Increased expression of the proliferation marker Ki67 (red) in the HER2+ subpopulation of CTC line Brx-142 (T-test p < 0.0001), compared with HER2− subpopulation, with no change in cleaved-caspase 3 (red). HER2+ cells (green); scale bar: 20 μm. Representative image from five independent fields are shown. (b) FACS analysis for the apoptotic marker Annexin V-FITC shows no difference in apoptosis between the HER2+ and HER2− subpopulations of FACS-purified CTC line Brx-142. Representative data from two independent experiments are shown. (c) Tumors initiated by HER2+ or HER2− CTCs (Brx-82: 200,000 cells) orthotopically injected into the mammary fat pad show differential growth rates; n=8. (d) Metastatic frequency of HER2+ and HER2− cultured CTCs (Brx-82: p=0.05 and Brx-142: p=0.009) following orthotopic injection; n=8. (e) Limiting dilution experiments demonstrate comparable tumor-initiating ability from 200 HER2+ and HER2− cultured CTCs (Brx-82, Brx-142); n=8.

