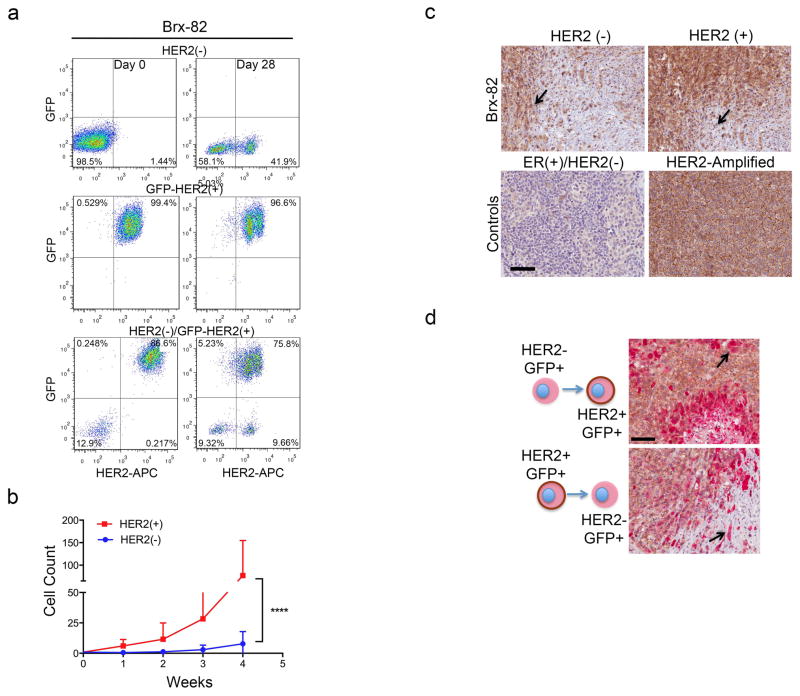
Extended Data Fig. 3. Dynamics of HER2+ and HER2− interconversion.
(a) FACS purified HER2+ and HER2− subpopulations from CTC line Brx-82 were monitored over 28 days to determine shifts in the composition of sorted populations. Representative data of two independent experiments are shown. (b) Growth curves for HER2+ (red) and HER2− (blue) FACS-purified single cell clones from CTC line Brx-142; Two-way ANOVA p-value < 0.0001; n=20. (c) IHC HER2 staining of tumor xenografts derived from unlabeled HER2− and HER2+ CTCs showing acquisition/loss of HER2 (brown), respectively. Arrows indicate regions of HER2 acquisition/loss. Representative image from at least 5 independent fields; n=8. ER+/HER2− and HER2-amplified breast cancers are shown below as controls. (d) Low magnification (landscape) view of HER2 IHC staining of tumor xenografts derived from mixed HER2+ and HER2− CTC cultures containing either GFP-tagged HER2+/HER2− cells (high magnification images are shown in Figure 2f). Upper panel: representative GFP-tagged HER2− cells give rise to GFP+/HER2+ cells (GFP: cytoplasmic red stain, HER2: cell surface brown stain). Lower panel: GFP-tagged HER2+ cells produce GFP+/HER2− cells. Scale bar: 100 μm.

