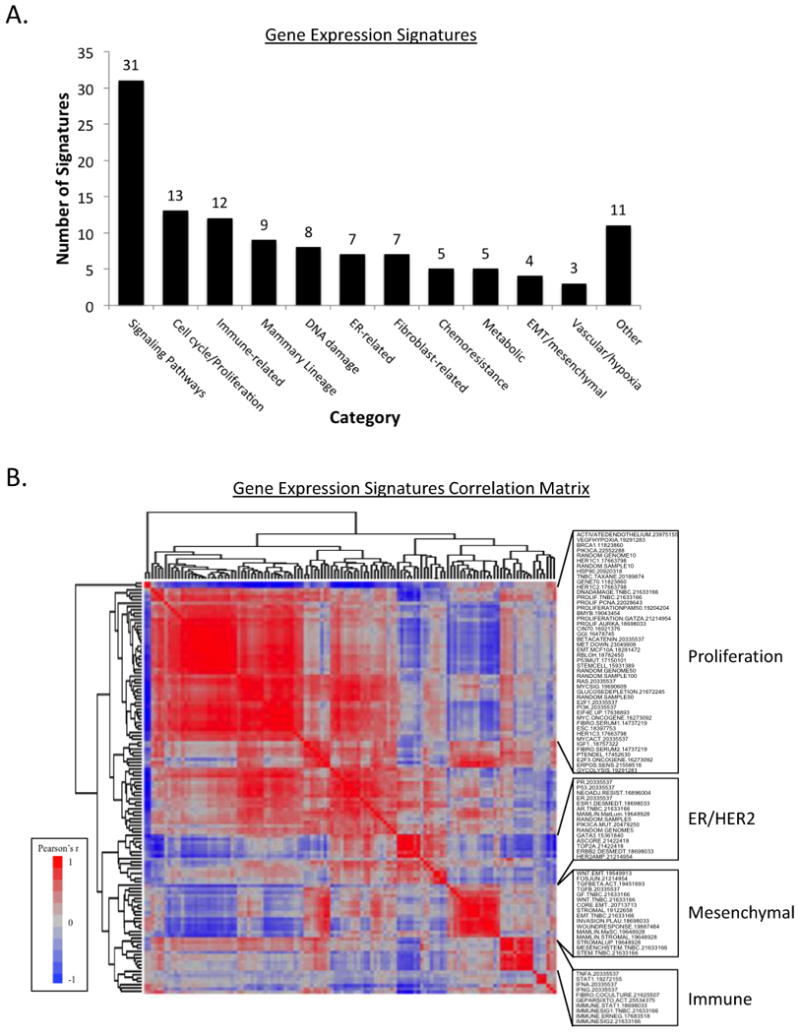
Figure 2. Gene Expression Signatures.

A. Gene expression signatures included in analysis categorized by reported target or phenotype.
B. Correlation matrix of 125 signatures. Heatmap of Pearson's correlation coefficient of pairwise correlation of each signature, clustered by association. ER, estrogen receptor; EMT, epithelial-to-mesenchymal transition.
