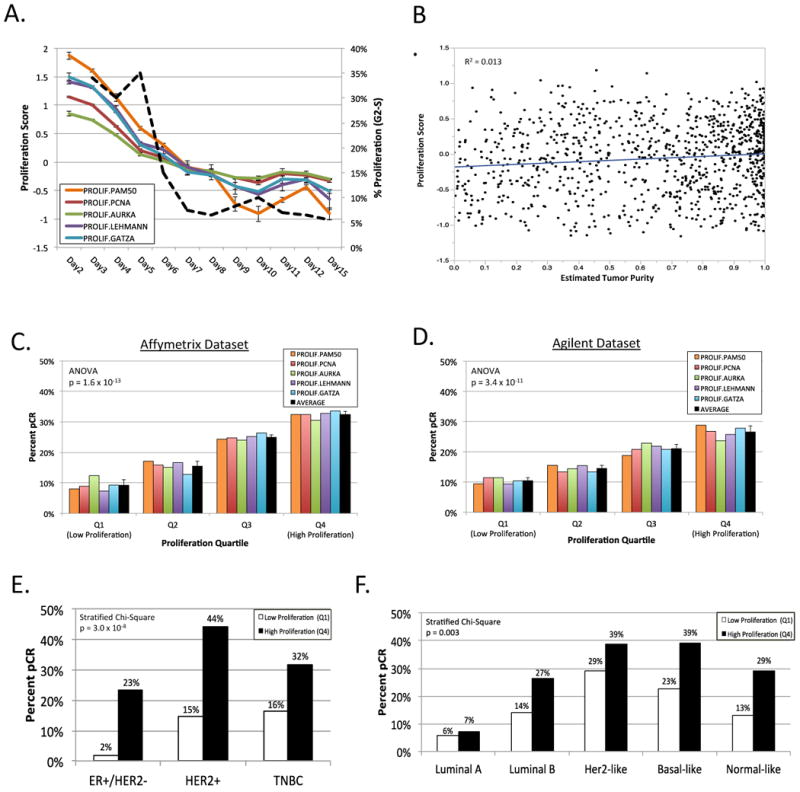
Figure 3. Gene Expression-Based Proliferation Signatures and Response to Neoadjuvant Chemotherapy.

A. 15-day time course experiment of MCF10A immortalized mammary epithelial cells in 3D in vitro culture. Proliferation signature value for five proliferation signatures(10, 15, 24, 31, 32) indicated in color with error bars representing standard deviation. Percent proliferating cells (in G2-S phase) by DNA content in dashed black line. B. Comparison of 11-gene PAM50 proliferation signature(32) with estimated tumor purity; line indicates best fit. C. & D. Percent pathologic complete response (pCR) by proliferation quartile for each of five proliferation signatures in Affymetrix dataset (C.) and Agilent dataset (D.). Error bars indicate standard deviation. E. & F. Percent pCR within subgroups of breast cancer by low proliferation (quartile 1) versus high proliferation (quartile 4) by receptor-based subtype (E.) or PAM50 subtype (F.). TNBC, triple-negative breast cancer.
