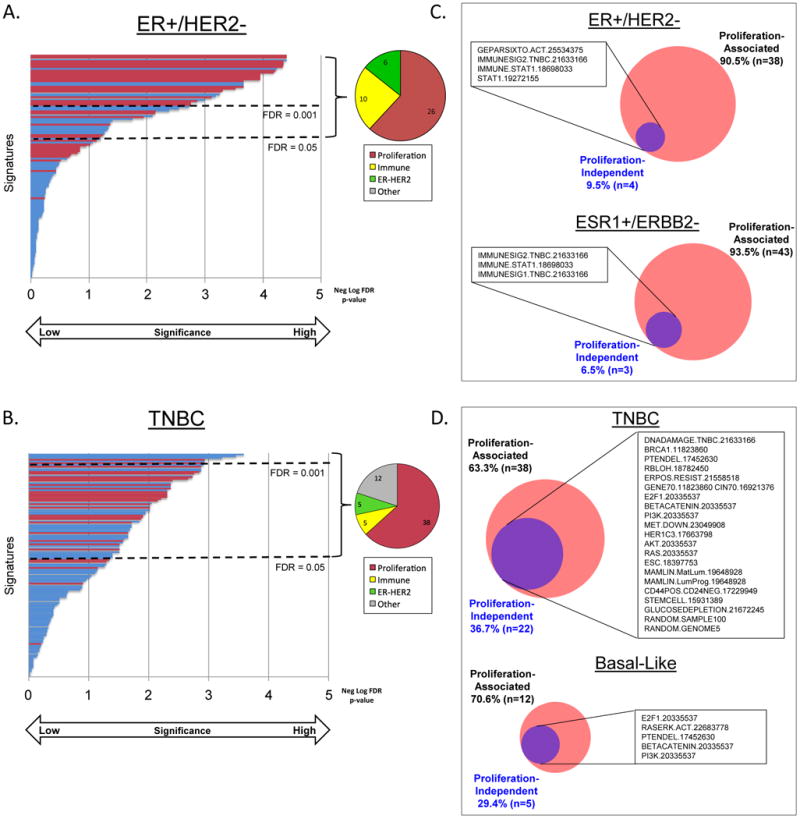
Figure 4. Signatures Associated with Response to Neoadjuvant Chemotherapy: Proliferation-Associated versus Proliferation-Independent.

A. & B. 125 gene expression signatures ordered from top to bottom by significance of association with response to neoadjuvant chemotherapy in estrogen receptor-positive/HER2-negative (ER+/HER2-; A.), and triple-negative breast cancer (TNBC; B.). Proliferation-associated signatures by correlation to the 11-gene PAM50 proliferation signature (32) (Pearson's r >0.40) indicated in red. Pie graphs indicate proportion of signatures significantly associated with response (FDR p<0.05) by correlation matrix-based signature category (Figure 2B.) C. & D. Venn diagrams of the number of signatures significantly associated with response in original dataset (red) versus proliferation-normalized dataset (purple). ESR1+/ERBB2- indicates tumors positive for ESR1 gene expression and negative for ERBB2 gene expression. TNBC, triple-negative breast cancer.
