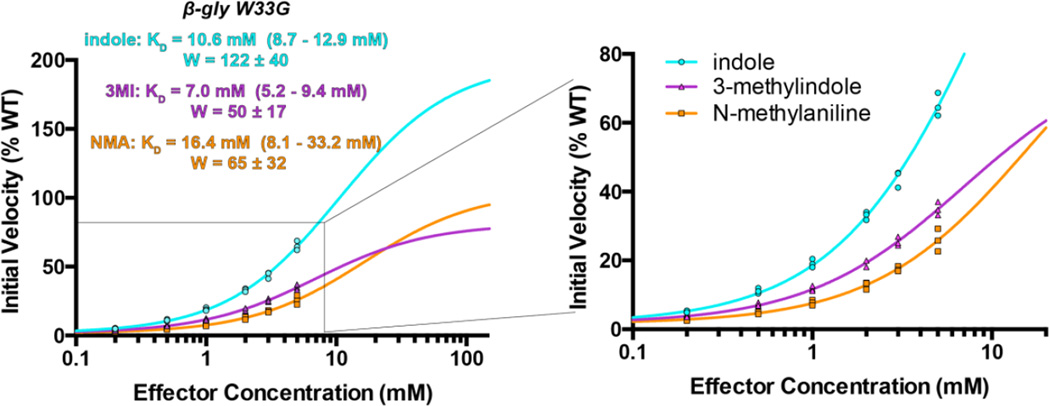
Figure 5. Full and partial agonism of β-gly W33G.
Enzyme assays carried out at high substrate concentration (750 μM FDGal) demonstrate the dependence of the initial velocity (and thus Vmax) on effector concentration. Both panels show the same data, expanded in the right panel to better show the agreement between the data and the model that was fit to it. All data were collected in triplicate, with all replicates shown explicitly on the plots. Experimental uncertainly of the fit values for KD and W are reported as a range corresponding to one standard error in either direction.

