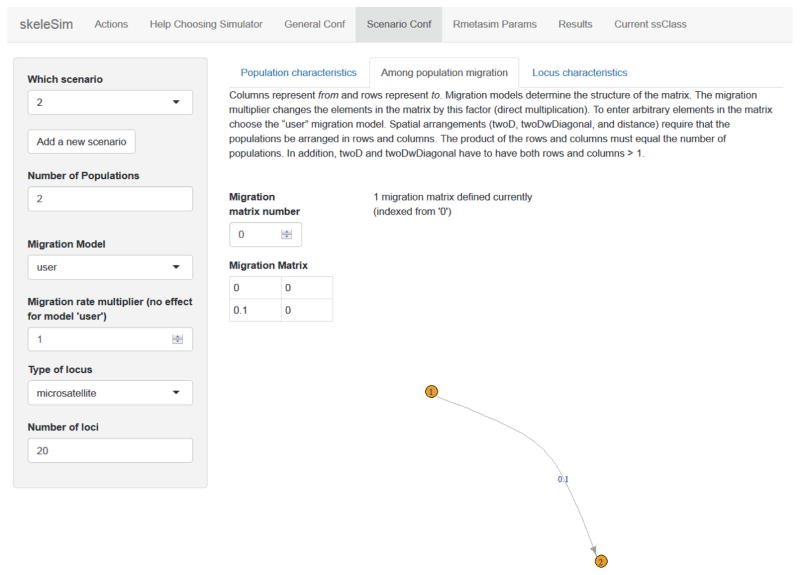
Figure 2. The ‘Scenario Conf’ tab of the skeleSim user interface.
In this tab the simulation scenarios are defined by the user. Migration rate and directionality are defined by the user in the matrix, and a matching population graph is automatically populated in the interface. This population graph corresponds to Scenario 2 of the ‘Forecasting’ example (see main text and skeleSim vignettes).

