
Figure 1. Synthetic-lethal genetic interactions in KRAS-mutant NSCLC cells.
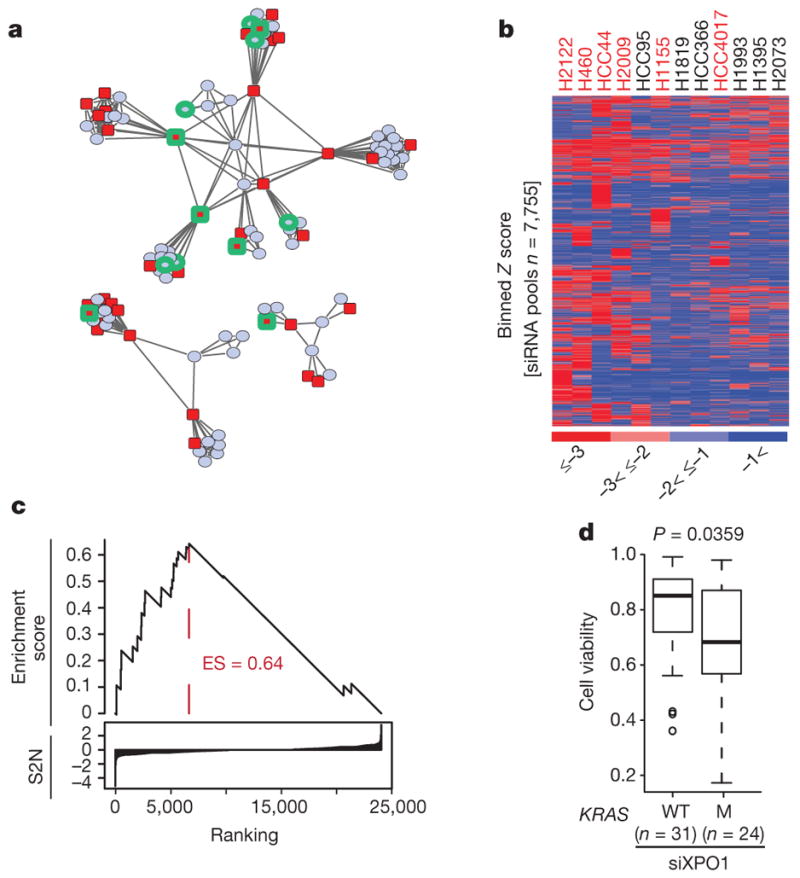
a, Two-dimensional APC projection of 106 NSCLC lines based on whole-genome variation in mRNA expression. Nodes represent cell lines and edges represent the Euclidean distance between cell lines. Red nodes, KRAS mutant (n = 37); blue nodes, KRAS wild type (n = 69). Cell lines subjected to whole-genome siRNA toxicity screening are highlighted in green. b, Binned Z-score distributions of selectively toxic gene depletions across the indicated cell lines. Cell lines (in columns; red label, KRAS mutant; black label, KRAS wild type) and siRNA target genes (rows) are clustered by two-way unsupervised unweighted pair group method with arithmetic mean (UPGMA). c, The reactome NEP NS2 interacts with the cellular export machinery. Empirical cumulative siRNA score distribution for a top-ranked KRAS-mutant-enriched gene set. S2N, signal-to-noise ratio. d, Differences in cell viability following XPO1 depletion with XPO1 siRNA (siXPO1) in KRAS-mutant versus KRAS-wild-type (WT) cell lines. Box plots indicate median and interquartile range (IQR). Unpaired t-test, P = 0.0359.