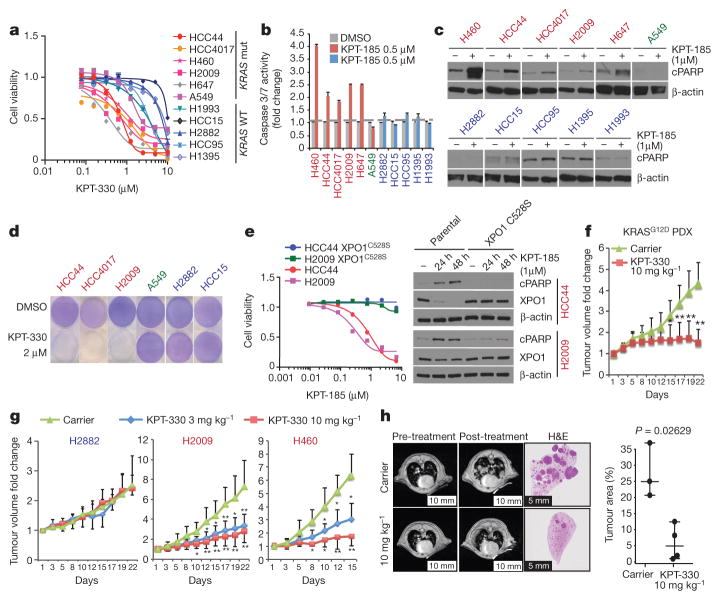
Figure 2. Selective sensitivity of KRAS-mutant NSCLC cells to chemical inhibition of the nuclear transport receptor XPO1.
a, Dose–response curves for a panel of NSCLC lines following a 72-h exposure to KPT-330. Data are mean ± s.d. (n = 3). b, Induction of Caspase 3/7 activity in KRAS-mutant lines by KPT-185. Bars indicate mean and range of data (n = 2). c, Accumulation of the cell death marker cleaved PARP (cPARP) in KRAS-mutant lines following exposure to 1 μM KPT-185. β-actin is shown as a loading control. d, Stationary-phase cell populations exposed to KPT-330 for 6 d (crystal violet). e, Rescue of XPO1 inhibitor toxicity by gene editing. Dose–response curves are as in a. Mean and range (n = 2). Immunoblots are as in c. f, g, Fold change in tumour volume in indicated xenografts upon XPO1 inhibition. *P <0.05, **P <0.01, Unpaired t-test, mean ± s.d. h, Representative lung magnetic resonance image of KrasLSL-G12D;p53fl/fl mouse is shown before and after treatment for each cohort. Post-treatment haematoxylin and eosin (H&E)-stained left lung lobe is shown. Tumour burden was calculated as the tumour area divided by lung area. Unpaired t-test, P = 0.0263; scale bars, 10 mm (left 4) and 5mm (right 2).

