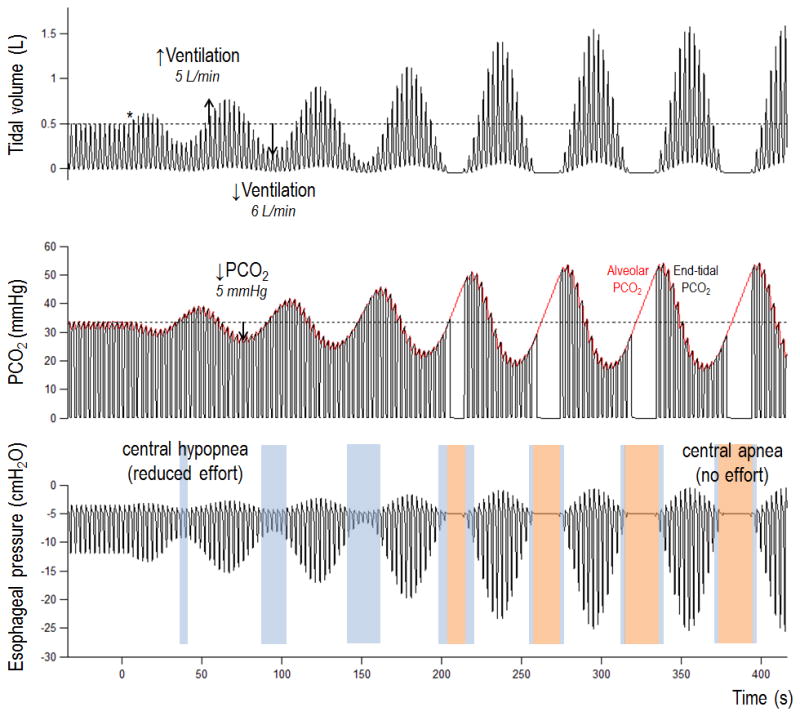
Figure 1.

Computer simulation of CSA in heart failure illustrating the impact of loop gain >1. Loop gain was set to 1.2 at the time denoted by the asterisk. As CSA builds-up, each undershoot in ventilation is ~1.2-times larger than the prior ventilatory overshoot (see text for details). The example also illustrates the spectrum of central events, from mild hypopnoeas to more severe apnoeas (left to right).
