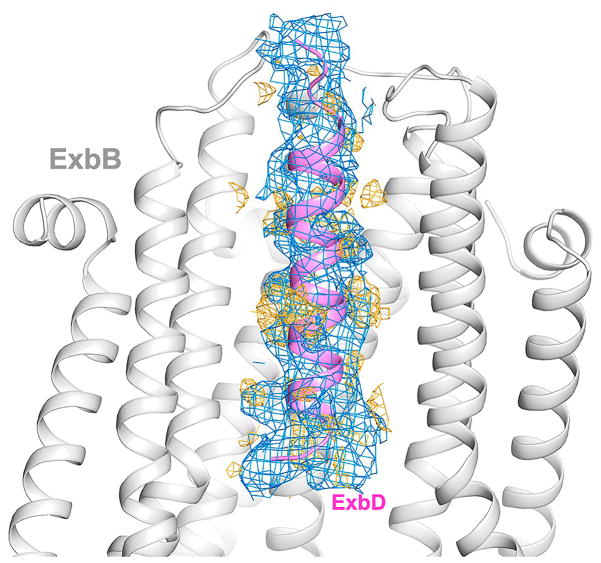
Extended Data Figure 5. Comparison of observed density for crystal structures of ExbB/ExbDΔperi solved at pH 7.0 versus pH 4.5.
The presence of electron density for the TM helix of ExbD (magenta ribbon) was dependent on the pH at which the crystals were grown. At pH 7.0, we observed little density (orange mesh) inside the TM pore of the ExbB (gray ribbon) pentamer (see also Extended Data Fig. 3). However, for the structures solved at pH 4.5, we observed clear density (blue mesh) for the TM helix of ExbD, albeit to varying degrees. Density maps (2Fo−Fc) are contoured at 1.0 σ.

