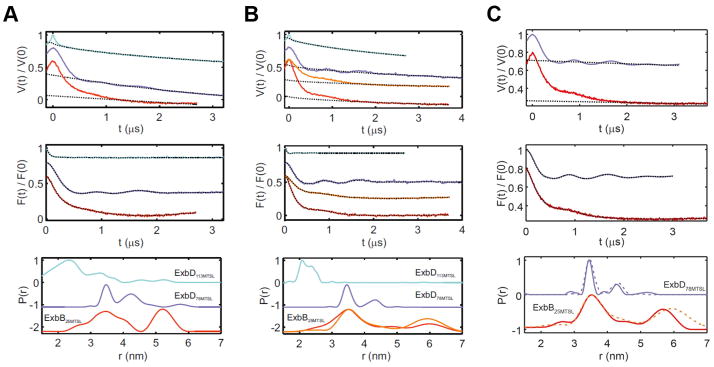
Extended Data Figure 7. DEER traces and analysis.
Ton subcomplex (ExbBC25/ExbD, ExbBC25S/ExbDN78C, and ExbBC25S/ExbDE113C) in 0.08% C10E5 (panel A) and in 0.03% DDM (panel B), and the fully assembled Ton complex (TonBC18A/ExbBC25/ExbD and TonBC18A/ExbBC25S/ExbDN78C) in 0.05% DDM (panel C). Upper panels, experimental Q-band DEER primary data V(t)/V(0) (colored lines, cyan ExbD113MTSL; violet ExbD78MTSL; red and orange, ExbB25MTSL) and simulated background functions (dotted line). Middle panels, DEER traces after background correction (colored lines) and fit with DeerAnalysis2015 (dotted lines) with Tikhonov regularization parameters from 10 to 100 adjusted via L-curve analysis and data validation. Lower panels, obtained distance distributions. For the pentameric ExbB sample (50% labeling efficiency), a modulation depth > 0.45 was obtained, indicating the presence of a multi-spin system. For the sample solubilized in DDM, longer DEER traces were obtained (4 μs) to better characterize the long distance peak of 5–6 nm in ExbB25MTSL. Additionally, for all panels, another DEER trace was measured after decreasing the microwave power of the 12 ns pump pulse to 25% (orange line) to suppress ghost peaks arising from the presence of more than two spins in the system. The resulting distance distribution (orange) was found to be very similar to that obtained with 100% microwave power (red), showing that no ghost peak artifacts were present. The lower modulation depth observed for the ExbD samples labeled at position 113 with respect to those labeled at position 78 (both labeling efficiency > 80%) may be due to the presence of distances < 1.5 nm (predicted by the simulations), which are outside of the sensitivity range of the technique or by destabilization of the ExbD dimer induced by the label. The bottom of panel C shows a comparison of the Ton subcomplex in DDM (dashed lines from panel B) to the fully assembled Ton complex (solid lines). All panels are from single experiments.

