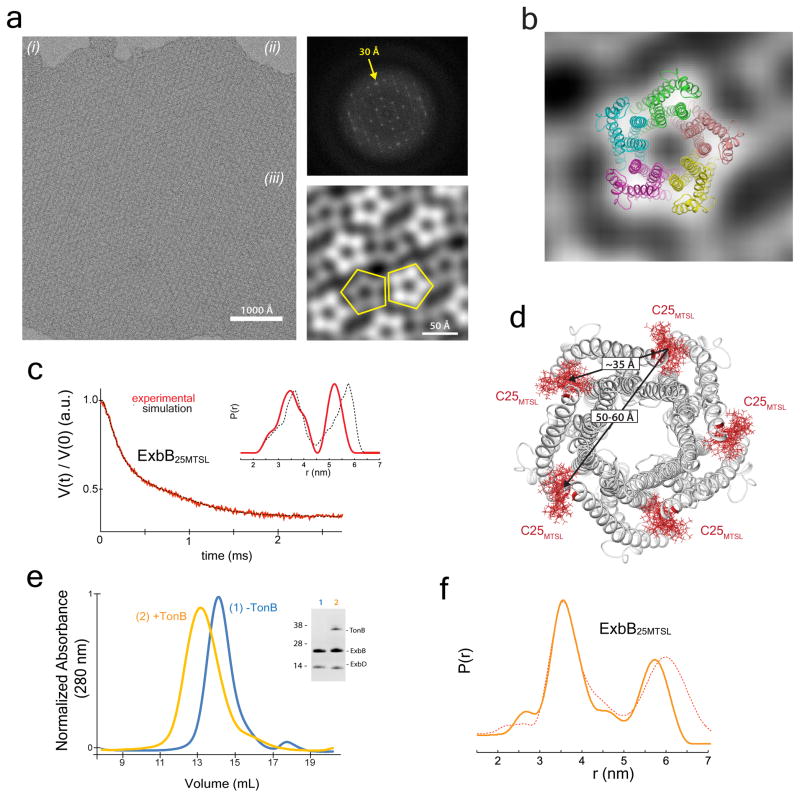
Figure 3. The oligomeric state of ExbB within the Ton complex.
a. EM analysis was performed using 2D crystals (i) of the Ton subcomplex with a power spectrum out to ~30 Å (ii). Five images were analyzed, and a representative average projection map calculated from 900 sub-images shows the complex is pentameric (iii). b. The EM studies agree that ExbB is a pentamer with edges measuring ~45 Å. c. DEER spectroscopy was performed on the Ton subcomplex labeled with MTSL at position C25 of ExbB. The experimentally measured traces and distance distributions (inset) (red lines) agree well with those calculated from the in silico labeled ExbB (black dashed lines). d. DEER analyses of the Ton subcomplex agree that ExbB is a pentamer. e. Purification of the fully assembled Ton complex (orange). f. Comparison of distance distributions of the fully assembled Ton complex (solid orange line) to those of the Ton subcomplex in DDM lacking TonB (dashed red line) showed minimal differences. Panels c, e, and f are from single experiments.

