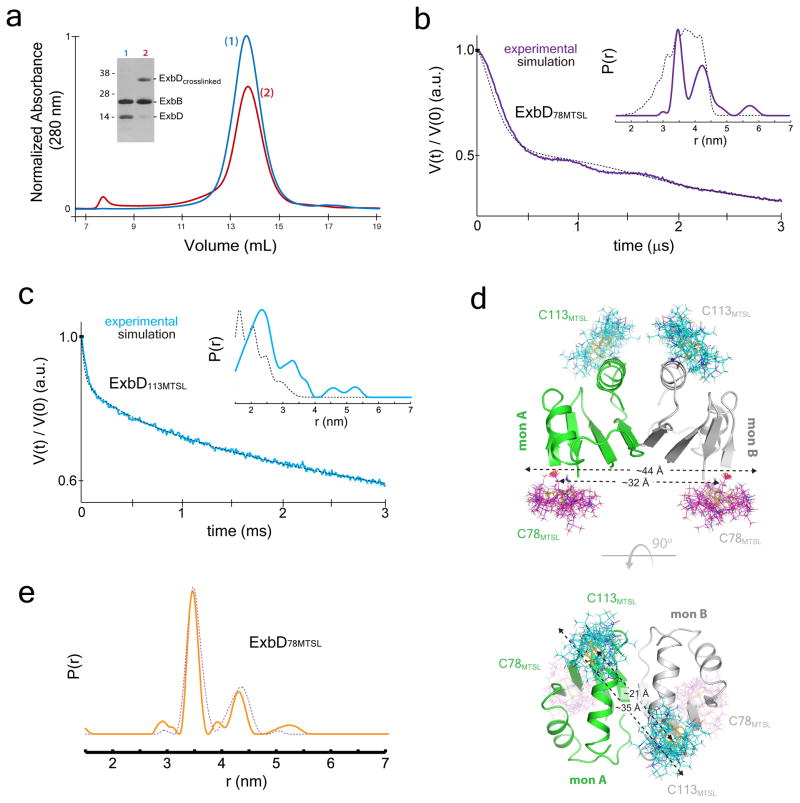
Figure 4. The oligomeric state of ExbD within the Ton complex.
a. Crosslinking studies targeting ExbD are consistent with a dimer within the Ton subcomplex, as evidenced by an observed crosslinked dimer (red, lane 2) compared to the non-crosslinked sample (blue, lane 1). b. DEER spectroscopy was performed on ExbD labeled at position 78 (purple lines) and position 113 (cyan lines) (panel c). The experimentally measured traces and distance distributions (inset) (purple and cyan lines) are consistent with those calculated (black dashed lines) from the in silico labeled ExbD dimer model (PDB ID 2PFU), which is based on the reported TolR structure (PDB ID 2JWK). d. The distance measurements within the in silico labeled ExbD dimer model are in agreement with those obtained experimentally at each site using DEER analysis. e. DEER spectroscopy was performed in DDM on the fully assembled Ton complex labeled at position 78 on ExbD. Comparison of distance distributions of the fully assembled Ton complex (solid orange line) to those of the Ton subcomplex in DDM lacking TonB (dashed purple line) showed minimal differences. Panels a, b, c, and e are from single experiments.

