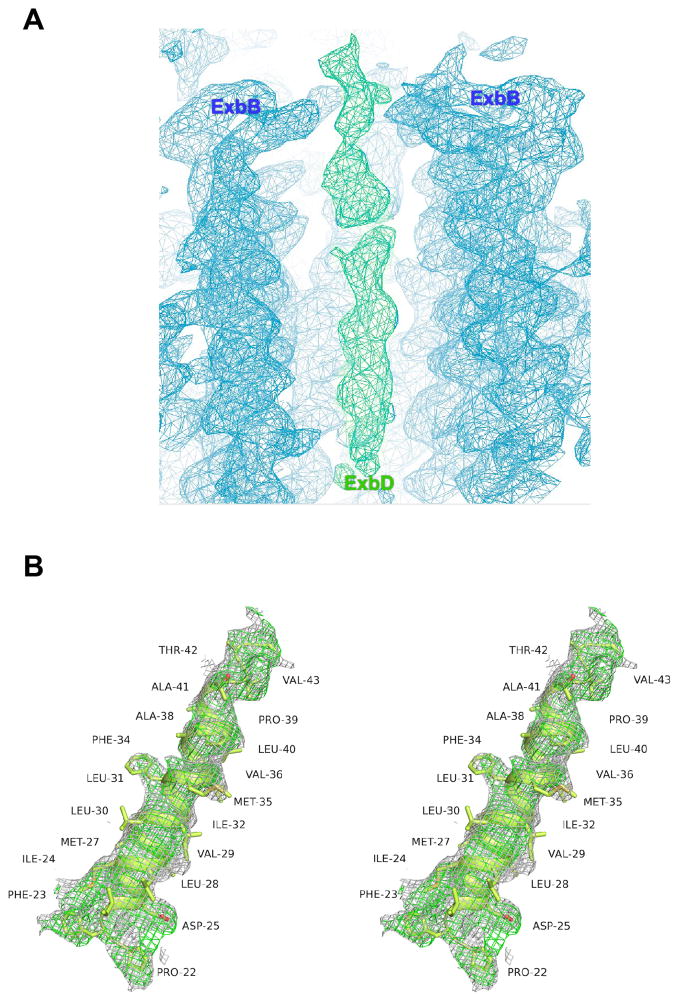
Extended Data Figure 4. Electron density for the TM helix of ExbD.
A. Omit map (2Fo−Fc, contoured at 1.0 σ) along the TM pore of ExbB. The density corresponding to the ExbB pentamer is shown in blue mesh, while the density corresponding to the TM helix of ExbD is shown in green mesh. B. Stereoimage showing the density (2Fo−Fc, contoured at 0.8 σ, gray mesh; 2Fo−Fc omit map (omitting the TM helix of ExbD), contoured at 0.8 σ, green mesh) for the the TM helix of ExbD after building and refinement.

