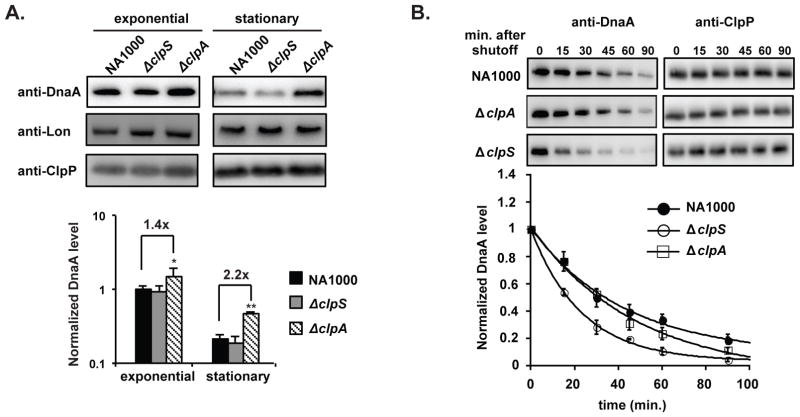
FIGURE 2. ClpA reduces DnaA levels in C. crescentus.
A. Levels of DnaA, Lon and ClpP in wildtype, ΔclpS and ΔclpA strains during exponential growth (3 hrs) or entering stationary phase (12 hrs) as shown by western blotting. Quantification of DnaA levels shown below (n= 3; error bars represent SD). P<0.05 (*) or P<0.01 (**). B. DnaA degradation following translational shutoff by chloramphenicol in wildtype, ΔclpS and ΔclpA strains during exponential growth. ClpP levels shown as controls. Quantification of DnaA is shown below (n=3; error bars represent SD).

