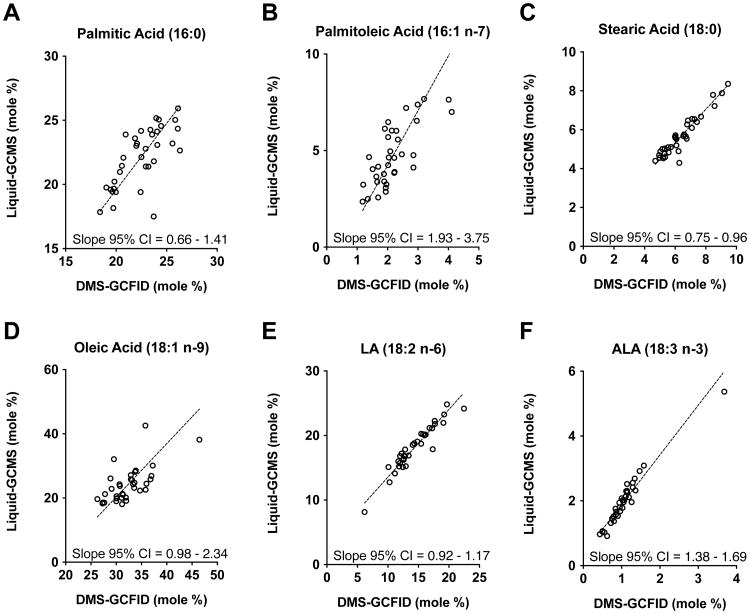
Figure 2. Deming regression analysis of abundant and essential dietary fatty acids in 2-week human milk.
Comparison between liquid-GCMS and DMS-GCFID methods showed no significant differences for the abundant human milk fatty acids (A, C, D, E), including palmitic (16:0), stearic (18:0), oleic (18:1 n-9), and LA (18:2 n-6), indicated by 95% CI values that contain 1.0. For the comparatively less abundant fatty acids palmitoleic (16:7 n-7) and ALA (18:3 n-3) (B and F), significant differences between methods were observed (95% CI values do not contain 1.0), indicating data from the two methods distribute disproportionately above or below the slope and the mol% values had method bias for these FA. The data for palmitic (16:0), palmitoleic (16:7 n-7), oleic (18:1 n-9) acids were dispersed away from the slope, despite significant similarities, indicating moderate agreement between methods for mol% values. Both methods produced mol% measurements for stearic (18:0), LA (18:2 n-6), and ALA (18:3 n-3) that were tightly nestled along the slope demonstrating outstanding method agreement. (n = 35)

