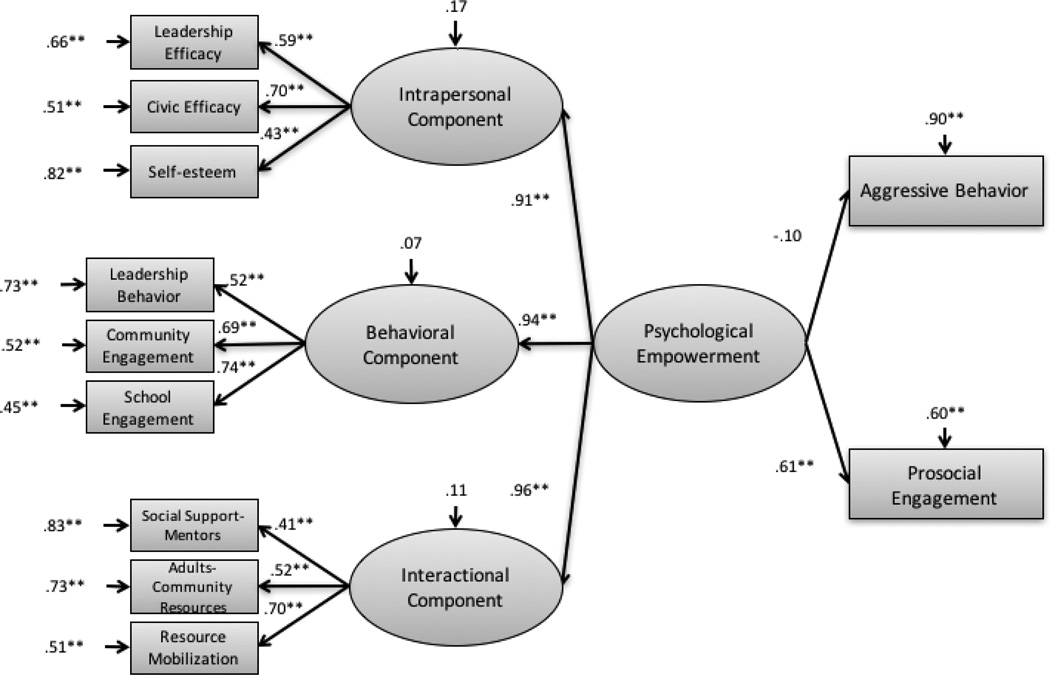
Figure 1. Measurement model for PE and structural model for the relationship between PE and youth outcomes with standardized estimates. **p>.001.
Note: Error correlations and covariate paths not shown. Error correlations for leadership efficacy and leadership behavior: 0.40, p<0.001; resource mobilization with civic efficacy: 0.38, p<0.001. Aggressive behavior and age: .14, p<.05; race/ethnicity (White reference group): −.49, p<.001. Prosocial behavior and age: −.04, p=.26; race/ethnicity: .20, p<.05.

