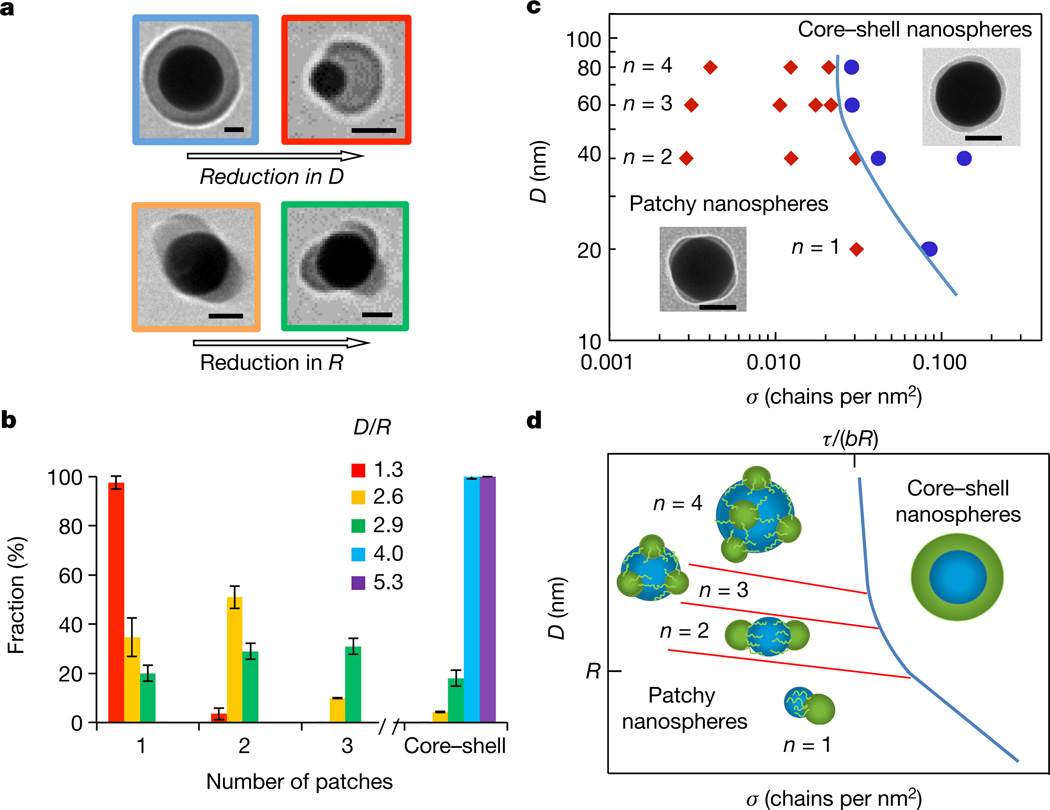
Figure 2. Structural transitions in the polymer layer on the surface of gold nanospheres.
a, Effect of nanosphere size (top) and polymer dimensions (bottom) on patch formation. The nanospheres are functionalized with polystyrene-50K (top row and bottom left) and polystyrene-30K (bottom right) at σ = 0.03 chains per square nanometre. Scale bars are 25 nm. b, Distribution of populations of nanospheres with a different patch number. The red, yellow, blue and violet bars correspond to the 20-, 40-, 60- and 80-nm-diameter nanospheres capped with polystyrene-50K, respectively; the green bar represents 32-nmdiameter nanospheres functionalized with polystyrene-30K. σ = 0.03 chains per square nanometre. The error bars represent the standard deviations. Each experiment was run in triplicate. The inset shows theD/R ratios, with colours corresponding to the colours of bars and the frames of the images in a. c, Experimental diagram of nanosphere states. The blue line separates the regions of core–shell and patchy nanospheres with a different average patch number n. The insets illustrate patchy and a core– shell nanospheres with σ of 0.012 and 0.03 chains per square nanometre, respectively. Scale bars are 50 nm. In b and c, 200–300 nanospheres were analysed for each population. d, Theoretical diagram of nanosphere states. Transitions between nanospheres with different values of n begin at D ≈ R (red lines). The blue line shows the boundary between the smooth and patchy polymer layer, approaching the grafting density σ = τ/(bR) for large nanospheres, similar to c.

