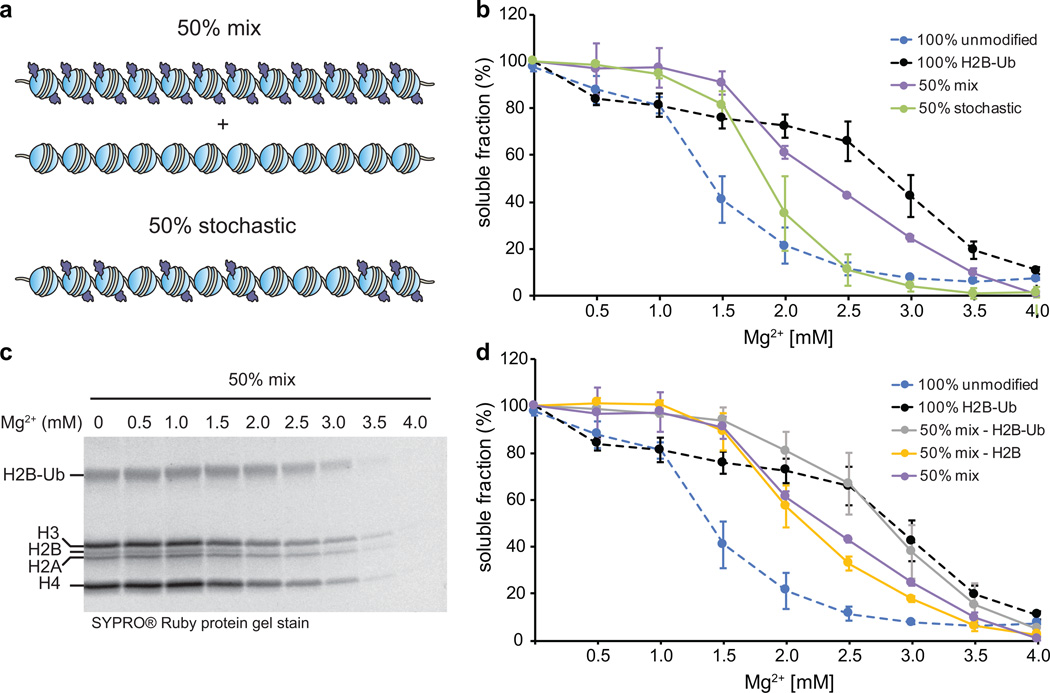
Figure 5.
Intra-array ubiquitin-ubiquitin interactions impede oligomerization. (a) A schematic depicting the composition of 50% mix and 50% stochastic arrays. (b) Comparison of the oligomerization of 50% mix and 50% stochastic arrays. (c) SDS-PAGE analysis of the supernatant fractions of 50% mix array samples as a function of Mg2+ concentration. Full gel image is given in Supplementary Fig. 16. (d) Quantitative analysis of the H2B-Ub and H2B band intensities shown in (c) compared to the oligomerization of 100% unmodified, 100% ubiquitylated and 50% mix arrays. (b) and (d) Error bars, s.e.m. (n = 3). The data for the unmodified and 100% ubiquitylated arrays are the same as in Fig. 3. All array samples contain the equivalent of 250 nM total 601 sites.

