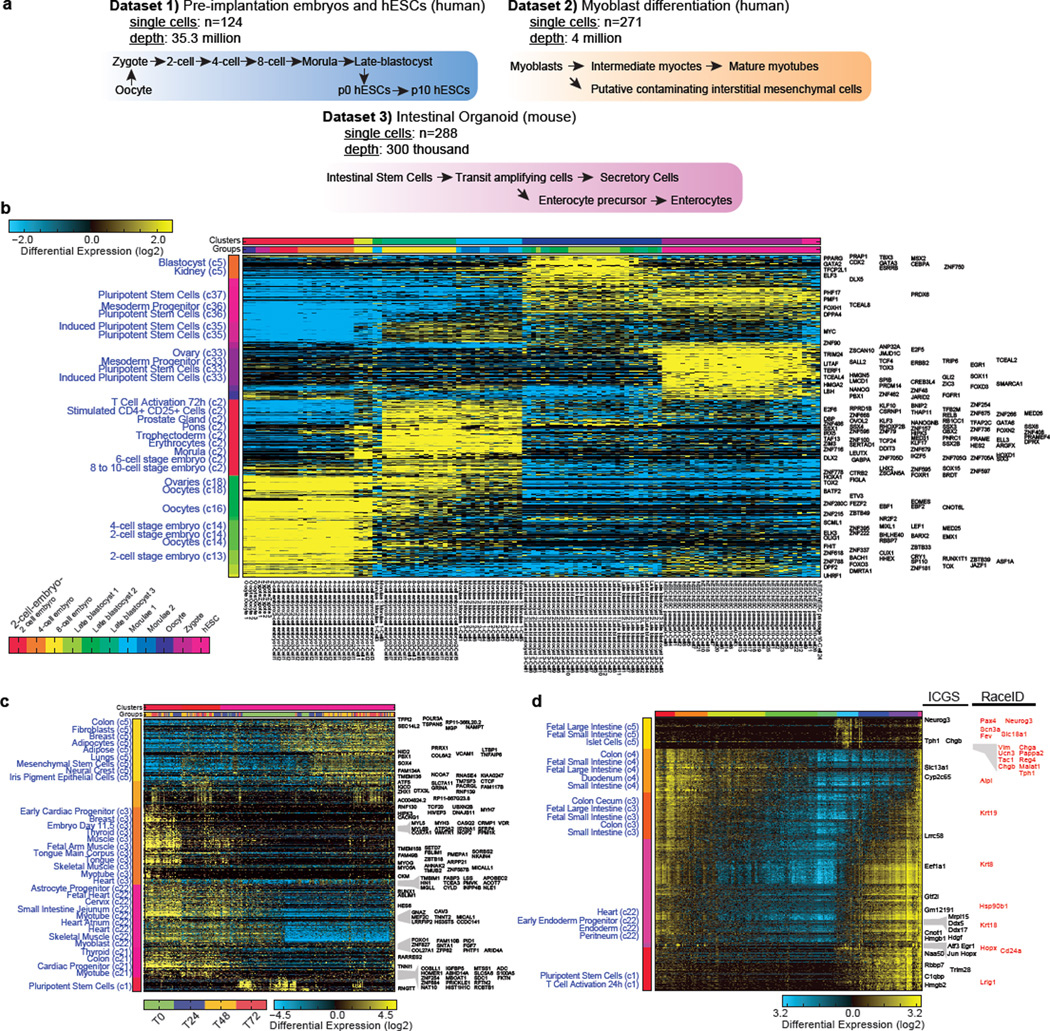
Extended Data Figure 5. Application of ICGS to diverse scRNA-Seq datasets.
a, Schematic overview of published embryonic5, myoblast4 and intestinal organoid1 scRNA-Seq datasets. b, HOPACH generated clusters derived using ICGS for human scRNA-Seq data for pre-implantation embryos and embryonic stem cells. c, HOPACH generated clusters using ICGS for human myoblast differentiation, without inclusion of cell cycle associated genes. d, HOPACH generated clusters using ICGS for mouse intestinal organoids1 for the discovery of rare cell populations. Novel rare population markers reported by the original study authors are highlighted in red. To the left of the heatmaps are predicted cell-types and tissues using AltAnalyze enrichment analysis (GO-Elite algorithm), using gene-sets from the imbedded MarkerFinder database. Enriched terms are ordered based on significance from the bottom to top in each indicated HOPACH cluster. Genes to the right of the heatmap are guide genes delineated by ICGS. The color bars above the heatmaps indicate either HOPACH clusters or input cell identities.

