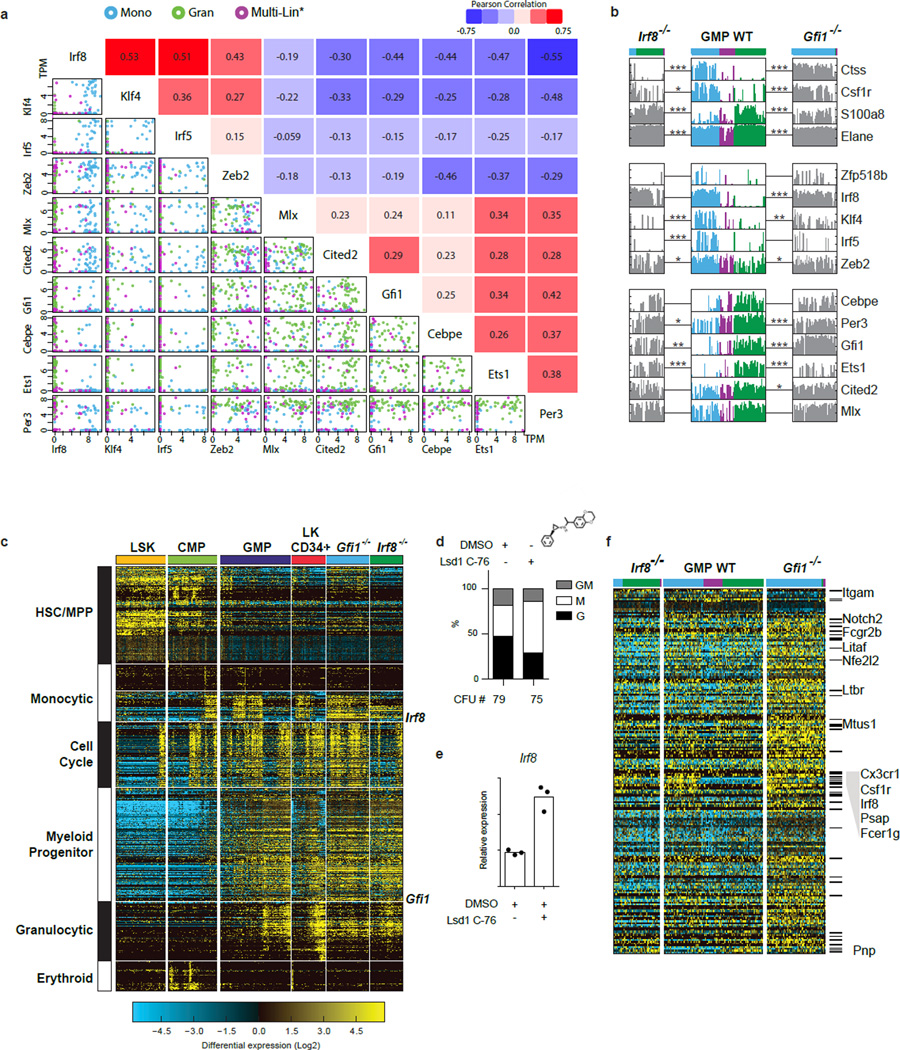
Extended Data Figure 7. TF to TF correlations, and TF loss-of-function analyses.
a, Scatterplots reveal the single-cell structure underlying correlations between TFs. Scatterplots generated in R (using the pairs function) show TPM of select transcription factor pairs in individual GMPs (colors corresponding to ICGS groups in Fig. 1d, top). Expression is given as TPM. Pearson correlation coefficients are indicated opposite to each plot. b, Plots displaying the incidence and amplitude of expression of select genes in Fig. 2a. Expression clusters of Irf8-high (blue) and Gfi1-high (green) or neither (Multi-Lin*; purple) are delineated. Significant changes in expression of key genes between Irf8−/− versus Irf8-high WT GMP, or Gfi1−/− versus Gfi1-high WT GMP are noted (* p<0.05, ** p<0.01, *** p<0.001 Benjamini-Hochberg adjusted). Note that Irf8−/− and Gfi1−/− GMP continue to express non-productive transcripts emanating from the mutant Gfi1 and Irf8 alleles. c. Gfi1−/− GMPs show a significant increase in cell cycle-related gene expression compared to wildtype or Irf8−/− GMPs. HOPACH clustering of Gfi1−/− and Irf8−/− GMPs using hematopoietic guide genes from Fig. 2a. All cells were first clustered by HOPACH and then grouped according to sorting gates. In agreement with our previous report that Gfi1 controls two genetically separable programs; granulopoiesis and Hox-based myeloid progenitor proliferation25, Gfi1−/− GMP demonstrate significantly increased HSC and cell-cycle-associated gene expression. Cell cycle associated genes were enriched (z-score>1.96) in Gfi1−/− and depleted (z-score <−1.96) in the Irf8−/− GMPs. d–e Lsd1 inhibition results monocytic colony formation and increased Irf8 expression. d, CFU assays performed with CD117+ bone marrow cells −/+ treatment with an Lsd1 inhibitor (GSK C-76). Y-axis displays percent distribution of colony types. Mean CFU number of three technical replicates shown. e, TaqMan analysis of Irf8 expression in CD117+ bone marrow cells −/+ treatment with C-76 (16 h). Mean of three technical replicates with similar results from 3 biological replicates. Representative plot from one of three independent experiments performed displayed (d,e). f, Heat map showing the expression of a subset of genes (214) associated with Gfi1 and Irf8 shared ChIP-Seq peaks. All displayed genes are significantly differentially expressed (p<0.05, Benjamini Hochberg adjusted) among at least one of the four comparisons (Irf8−/− versus WT; Irf8−/− versus Irf8-high WT; Gfi1−/− versus WT; Gfi1−/− versus Gfi1-high WT). Marked genes (−) are associated with ImmGen monocyte-dendritic-precursor genes sets, and named genes are associated with abnormal mononuclear cell morphology (Mouse Phenotype Ontology). c, Gfi1 (green), Irf8 (blue) and Cebpα (red) ChIP-Seq and RNA-Seq tracks illustrating co-regulation at select loci. Gfi1 and Irf8 ChIP-Seq and bulk RNA Seq were performed using wild-type GMP (as in ED Fig. 1j). Cebpα ChIP-Seq data was obtained from GEO record GSE43007. Significant peaks called by MACS are represented as bars under each ChIP-Seq track. Regions that have called peaks overlapping for Gfi1, Irf8 and Cebpα are highlighted by a box. Strand specific RNA seq are displayed as black and grey peaks, respectively. RefSeq gene structure presented at bottom.

