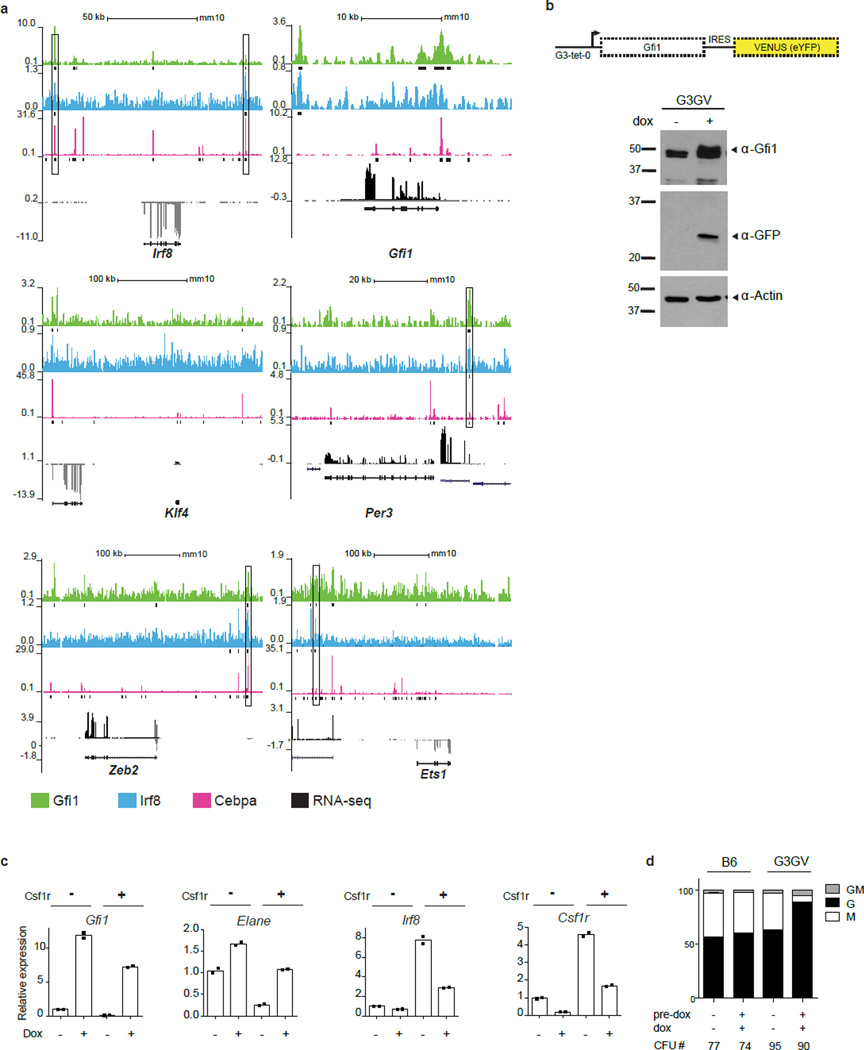
Extended Data Figure 8. Counter-acting functions of Irf8 and Gfi1 in myeloid cell fate choice.
a, Gfi1, Irf8 and Cebpα ChIP-Seq and RNA-Seq tracks illustrating coregulation at select loci. Gfi1 and Irf8 ChIP-Seq were carried using crosslinked wild type GMP whereas the RNA-Seq were performed using wild type GMP. Cebpα ChIP-Seq data was obtained from GEO record GSE43007. Significant peaks called by MACS are represented as bars under each ChIP-Seq track. Regions that have called peaks overlapping for Gfi1, Irf8 and Cebpα are highlighted by a box. Strand specific RNA seq are displayed as black and grey peaks, respectively. Refseq gene structure presented at bottom for Irf8, Gfi1, Klf4, Per3, Zeb2, and Ets1. b–d G3-tetracycline-inducible promoter-driven Gfi1 allele (G3- Gfi1-IRES-Venus eYFP = “G3GV”) results in granulocytic differentiation. b, Schematic representation of the Col1A1 locus of KH2 ES cells engineered using FLP recombinase to harbor a G3-tetracycline-inducible promoter-driven Gfi1 allele (G3-Gfi1-IRES-Venus eYFP = “G3GV”). KH2 ES cells also contain a ROSA-allele which expresses the rtTA-M2 protein. Immunoblot of Gfi1 and Venus eYFP expression in ES cells. G3GV KH2 ES cells were treated with 1µg/ml doxycycline for 48 hours, then analyzed for Gfi1 and Venus expression by immunoblotting. For gel source data, see Supplementary Figure 1. c, TaqMan analysis of gene expression in Csf1r- and Csf1r+ GMPs, +/− doxycycline induction of G3GV using one allele encoding rtTA. Mean of two technical replicates represented. d, CFU assays using lineage negative bone marrow cells from wild type B6 or G3GV knock-in mice. Cells were cultured with or without 1µg/ml doxycycline, in methylcellulose media. Percent distribution of colony types is displayed on y-axis. Mean CFU number ± SEM (bottom) (n=3 wells per condition). Representative plot from one of three independent experiments performed displayed (c,d)

