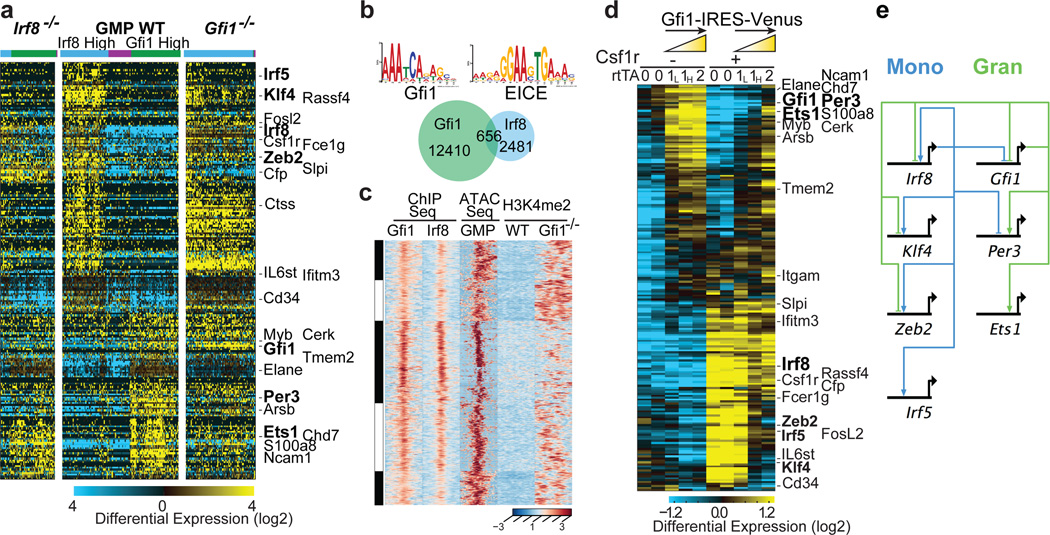
Figure 2. Counteracting gene regulatory network underlying myeloid cell fate determination.
a, HOPACH clustering of wild type (WT), Irf8−/− and Gfi1−/− GMPs using Gfi1- or Irf8-correlated genes derived from scRNA-Seq of WT GMPs (rho>0.3, TPM>1). Genotypes and cell clusters of Irf8-high (blue) and Gfi1-high (green) or neither (purple) are indicated. along with genes shared with ICGS. b, ChIP-Seq analysis of Gfi1 and Irf8 in GMPs. Statistically enriched Gfi1 (p=6.63×10⁻⁸) and Ets-Irf composite element (EICE) motifs (p=1.08×10⁻⁶) are displayed. Venn diagram illustrates Gfi1, Irf8 and overlapping ChIP-Seq peaks. c, Integrative K-means cluster heatmap of overlapping Gfi1 and Irf8 peaks (656 genomic regions). Corresponding ATAC-Seq analysis in GMPs (GSE60103) and H3K4me2 ChIP-Seq tracks in wild type or Gfi1−/− lin− bone marrow cells are shown. d, RNA-Seq analysis of GMPs with inducible Gfi1 expression. GMPs harboring tetracycline-inducer (rtTA-M2) and tetracycline-responsive (Gfi1-IRES-Venus) alleles were incubated with doxycycline overnight, then sorted for Venus expression. GMPs carrying one rtTA-M2 allele were sorted on the basis of low (1L) versus high (1H) Venus expression. Hierarchical clustering was performed as in Fig. 2a. Select genes shared with ICGS are indicated. e, Myeloid gene regulatory network displayed using BioTapestry51. Regulatory connections summarize perturbation and ChIP-Seq experiments. Indicated TFs are known or predicted to regulate monocyte/dendritic (left) or neutrophil (right) specification, respectively.

