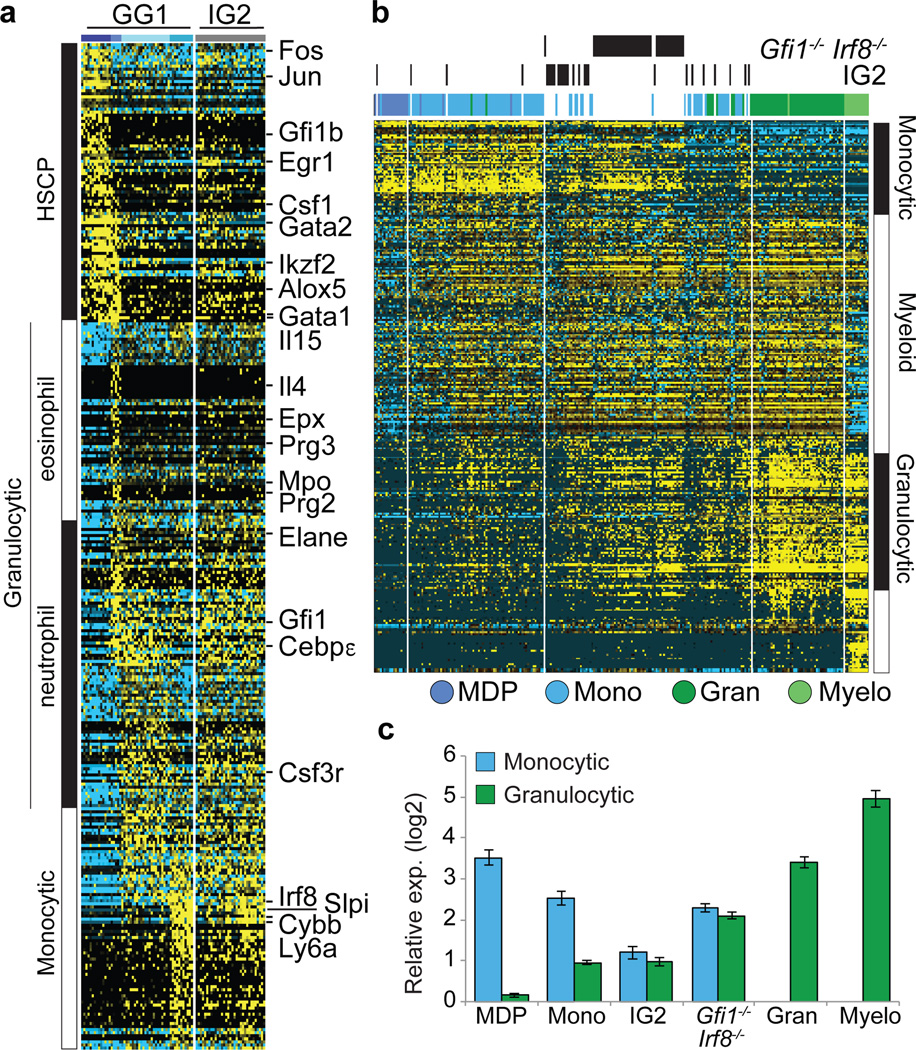
Figure 4. Trapping rare myeloid transition state by removal of counteracting determinants.
a, ICGS-based scRNA-Seq analysis of GG1 and IG2 cells (see Extended Data Figure 9 and Supplementary Methods). Known hematopoietic regulators and markers are indicated (right). b, HOPACH clustering of WT, IG2 and Irf8−/−Gfi1−/− GMPs based on ICGS-delineated genes (Fig. 1b), with indicated myeloid cellular states (right) (see global analysis in ED Fig. 10l). c, Monocyte or granulocyte gene enrichment analysis. The median expression value of a gene within cells of designated group was compared to its median value in all cells (Extended Data Fig. 10l) and average fold change (log2 ± SEM) was determined for monocytic or granulocytic genes.

