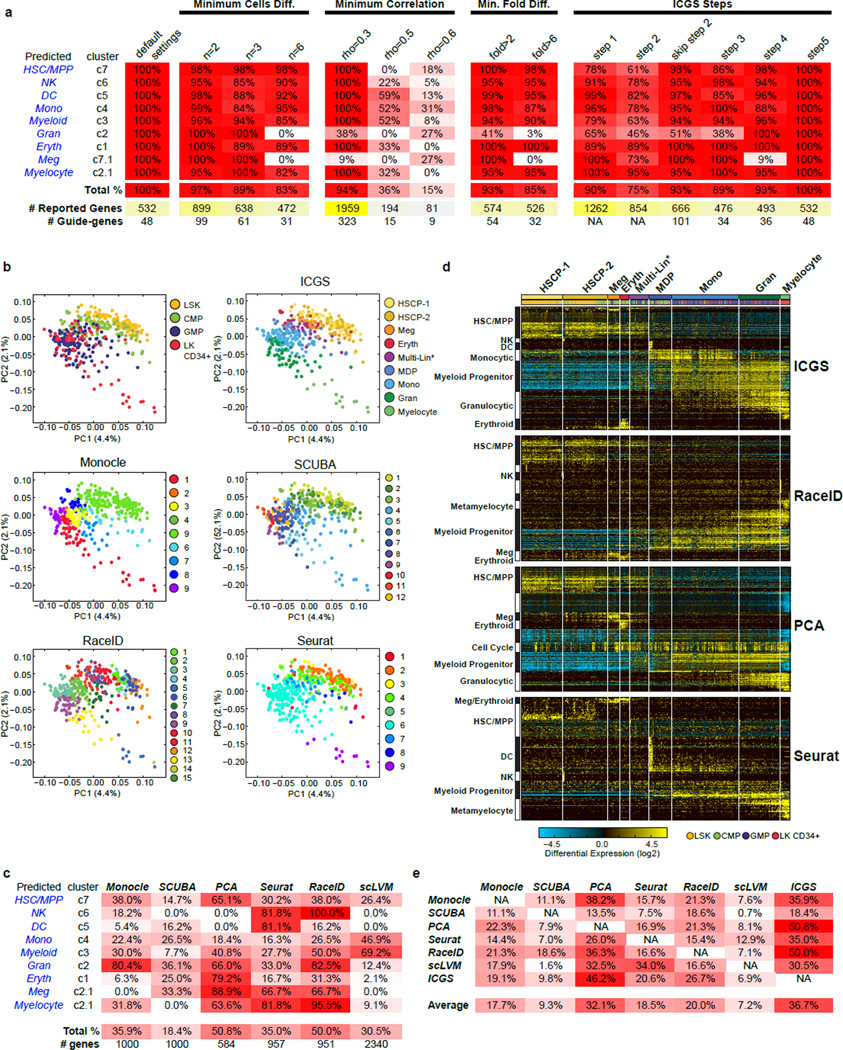
Extended Data Figure 4. Comparing ICGS with Monocle, SCUBA, RaceID, PCA, Seurat, and scLVM for the analysis of scRNA-Seq data.
a, Table comparing ICGS derived cell population gene-set results using different ICGS parameters. These parameters include minimum cells differing between the highest and lowest values for a gene for an indicated minimum fold difference and minimum Pearson correlation threshold. The results indicated under ICGS Steps refers to the gene outputs from each step of ICGS or from the entire workflow with exclusion of step 2. b, PCA visualization of the first two principal components of all expressed genes (ICGS step 1), following z-score normalization of all TPM values. Cells are colored according to the flow cytometric gate (top left), according to their ICGS clusters (top right) or for cell populations indicated by the different evaluated algorithms (Monocle, SCUBA, RaceID, Seurat). c, Table comparing ICGS derived cell population gene-sets for different scRNA-Seq algorithms. d, Direct comparison of gene expression results from different selected scRNA-Seq algorithms. All cells are ordered based on the ICGS output and genes clustered by HOPACH. Gene set enrichment analysis results for ICGS delineated gene populations (GO-Elite) are displayed to the left of each HOPACH gene cluster. e, Table comparing the relative overlap of the top significant gene sets produced by each of the scRNA-Seq algorithms.

