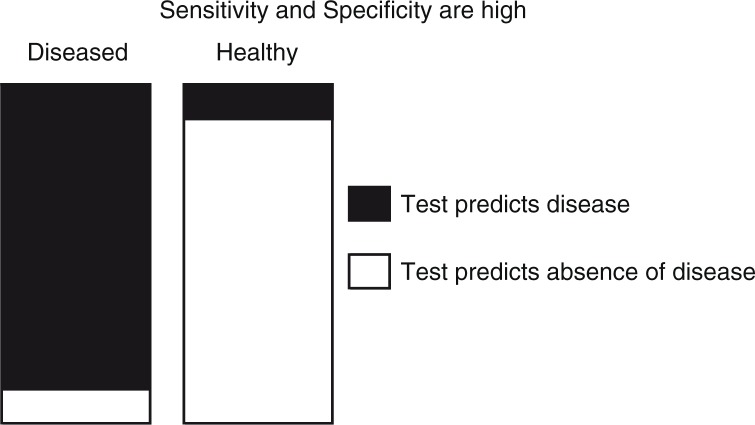
Fig. 2.
Distribution of test results when the prior probability of the sought after disease is 50%. It illustrates that when the sensitivity is high, there are relatively few diseased persons who test negative (white). Similarly, when specificity is high few healthy persons test positive (black). Therefore, a positive test result is truly likely to represent disease, and a negative result is truly likely to represent the absence of disease.

