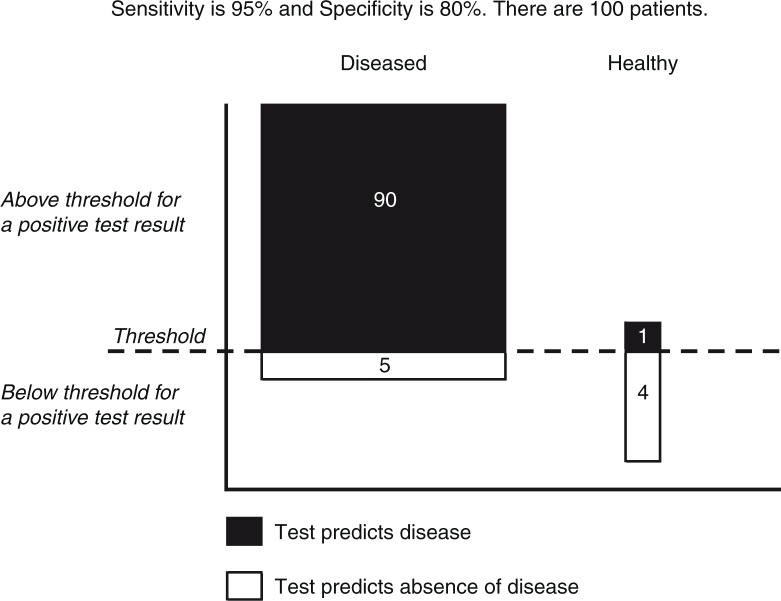
Fig. 6.
Distribution of test results relative to a threshold value when the prior probability of the sought after disease is high (95%). In the situation in which a prior probability is high, a test generally adds little. In this case, the prior probability is 95%. A positive test adds only 4% to the positive predictive value (90/91=0.99=99%). Numbers in the illustration are rounded to the closest digit.

