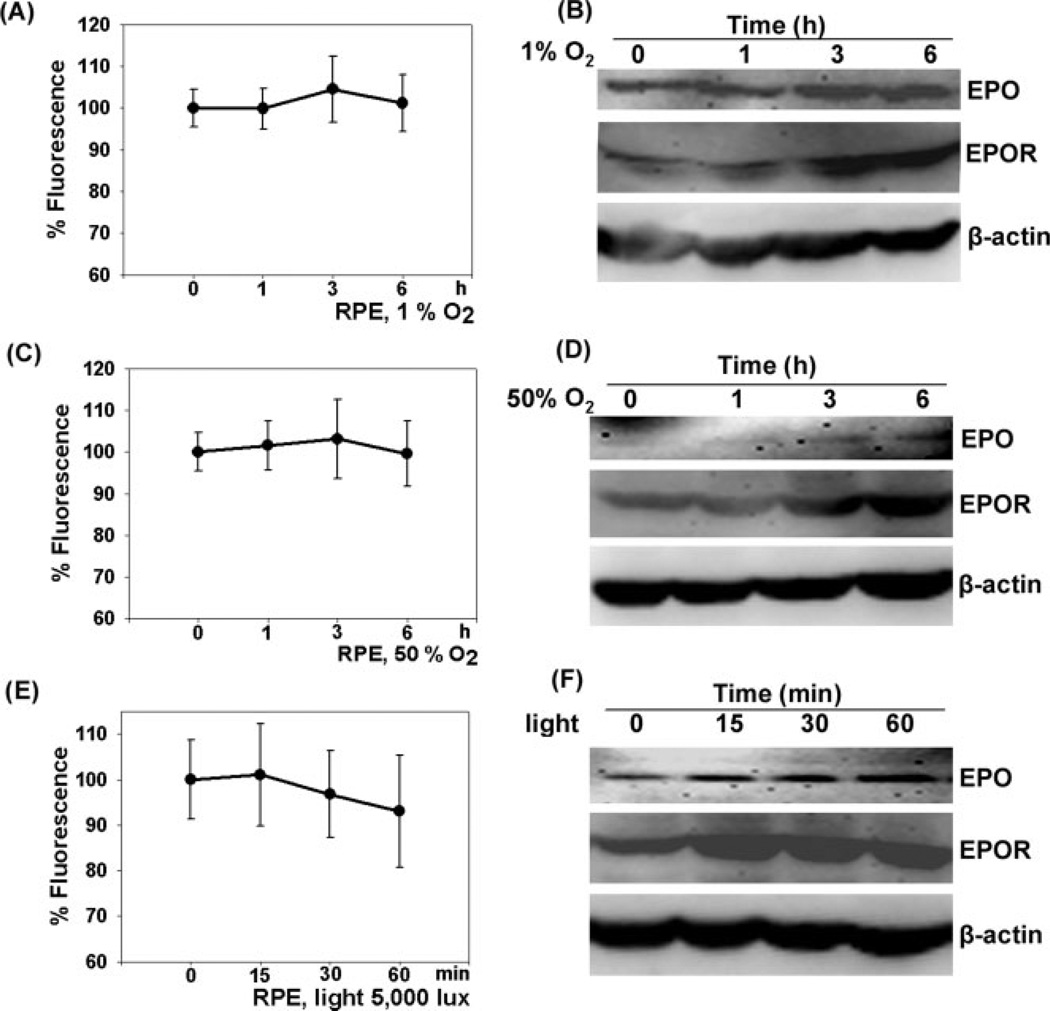
Fig. 4.
Up-regulation of EPO/EPOR expression in the RPE exposed to hypoxia (1% O2; A,B) hyperoxia (50% O2; C,D), or light (5,000 lux; E,F). A: Data represent percentage intensity of DNA fluorescence that is proportional to the number of surviving cells (mean ± SD, ★P < 0.05, n = 6) of human RPE cell cultures exposed to 1% O2 for 1, 3, and 6 hr. No significant cell death was seen. B: Immunoblots for EPO and EPOR show that 3 hr after exposure to hypoxia EPO/EPOR expression increased. C: Data represent percentage intensity of DNA fluorescence that is proportional to the number of surviving cells (mean ± SD, ★P < 0.05, n = 6) of RPE cell cultures exposed to hyperoxia for 1, 3, and 6 hr. No significant cell death was seen. D: At 3 hr after exposure to hyperoxia, EPO and EPOR expression increased. E: Data represent percentage intensity of DNA fluorescence that is proportional to the number of surviving cells (mean ± SD, ★P < 0.05, n = 6) of human RPE cell cultures exposed to 5,000 lux light for 15, 30, and 60 min. No significant cell death was seen. F: As early as 15 min after exposure to light, EPO/EPOR expression increased until 60 min.

