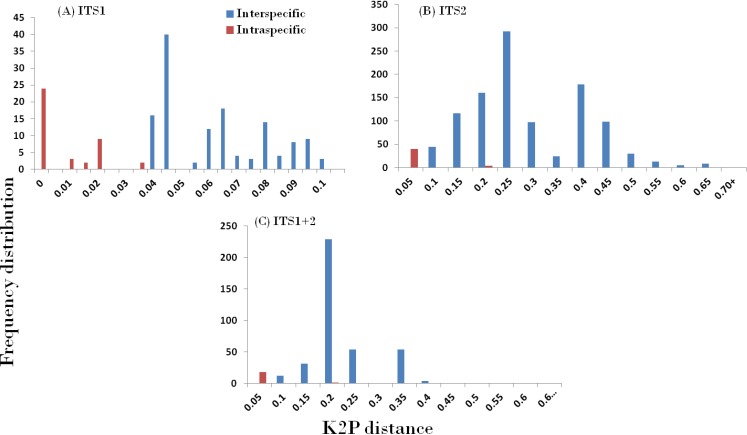
Figure 2. Evaluation of DNA barcoding Gap.
Relative distributions of intra- and inter-specific distances based on PWG-distance based methods for the three nrITS datasets in Cassiinae. x axes relate to Kimura 2-parameter (K2P) distances arranged in intervals, and the y axes correspond to the frequency distribution.

