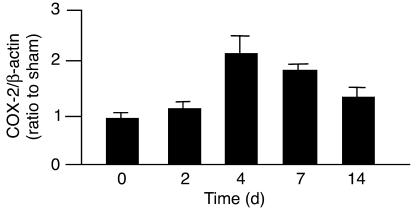
Figure 3.
Expression of COX-2 mRNA in the WT kidney in 2K1C model. The expression of COX-2 mRNA increased significantly after the operation and reached a peak level at day 4 of 2K1C. Each column represents mean ± SEM of 5_12 mice per group. Values were expressed as a ratio of COX-2/β-actin mRNA of 2K1C mice to that of sham-operated mice.

