Figure 5.
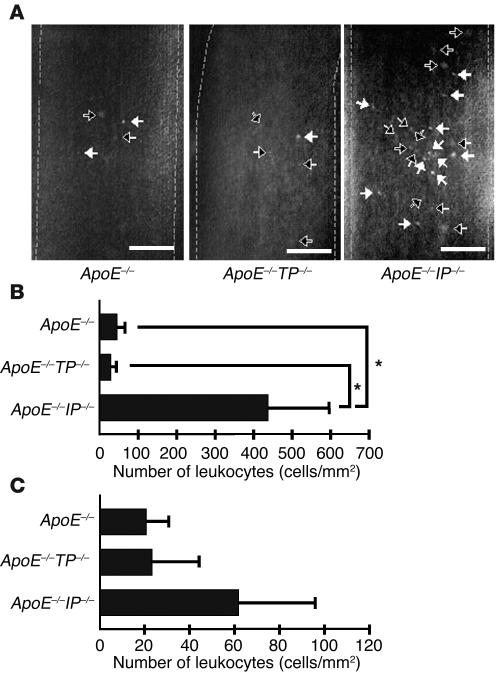
Intravital microscopy for leukocyte rolling and adhesion. (A) Fluorescence images of rolling and adherent leukocytes. Black and white arrows indicate rolling and adherent leukocytes, respectively. Vessel lumens are outlined by broken lines. Scale bars: 0.1 mm. (B) Quantitative analysis of rolling leukocytes. Data are means ± SEM (n = 5 each). *P < 0.05 versus apoE_/_ and apoE_/_TP_/_ mice. (C) Quantitative analysis for adherent leukocytes as described in B.

