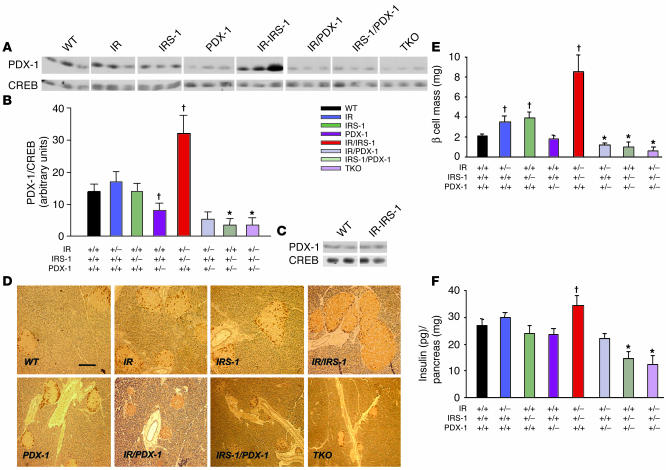
Figure 3.
Expression of PDX-1 in pancreas and reduced β cell mass and pancreatic insulin content in IRS-1/PDX-1 and TKO mice. (A) Western blotting of PDX-1 and CREB proteins prepared from pancreas as described in Methods. Each lane corresponds to an individual mouse (n = 3). (B) Quantitation of PDX-1 levels in A. Data are depicted as the ratio of PDX-1 to CREB and expressed as arbitrary densitometry units. *P < 0.05, PDX-1 vs. IRS-1/PDX-1 or TKO; P < 0.05, PDX-1 or IR/IRS-1 vs. WT (n = 3). (C) Western blotting of PDX-1 and CREB proteins prepared from freshly isolated islets from WT and IR/IRS-1 mice (n = 2). (D) Representative pancreas sections were stained with cocktail antibody to non-β cell hormones as described in Methods. Scale bar: 50 μm. (E) β Cell mass was estimated by morphometric analysis as described in Methods. *P < 0.05, IR/PDX-1, IRS-1/PDX-1, or TKO vs. PDX-1; P < 0.05, IR, IRS-1, or IR/IRS-1 vs. WT. (F) Pancreatic insulin content was measured in acid-ethanol extracts of homogenized pancreas as described in Methods. *P < 0.05, IRS-1/PDX-1 or TKO vs. PDX-1; P < 0.05, IR/IRS-1 vs. WT (n = 4_6).

