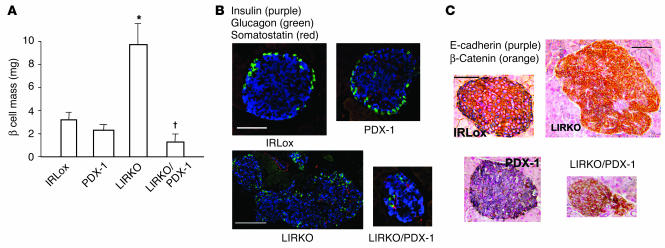
Figure 6.
Alterations in a second model of islet hyperplasia, the LIRKO. (A) β Cell mass was estimated by morphometric analysis as described in Methods. *P < 0.05, LIRKO vs. IRLox (control), PDX-1, or LIRKO/PDX-1; P < 0.05, LIRKO/PDX-1 vs. IRLox or PDX-1 (n = 4_6). (B) Representative islets from pancreas sections from the LIRKO group, costained for insulin (purple), glucagon (green), and somatostatin (red). (C) Representative pancreas sections from IRLox, PDX-1, LIRKO, and LIRKO/PDX-1 mice, costained for E-cadherin (purple) and β-catenin (orange) as described in Methods. Scale bars: 50 μm.

