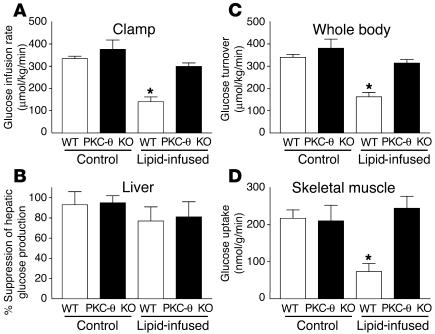
Figure 1.
Tissue-specific insulin action in WT (white bars) and PKC-θ KO (black bars) mice with saline or lipid infusion. (A) Steady-state glucose infusion rate, obtained from averaged rates of 90_120 minutes of hyperinsulinemic-euglycemic clamps. (B) Insulin-mediated percentage suppression of basal hepatic glucose production. (C) Insulin-stimulated whole-body glucose turnover in vivo. (D) Insulin-stimulated skeletal muscle (gastrocnemius) glucose uptake in vivo. Values are mean ± SE for five to seven experiments. *P < 0.05 versus WT mice (control).

