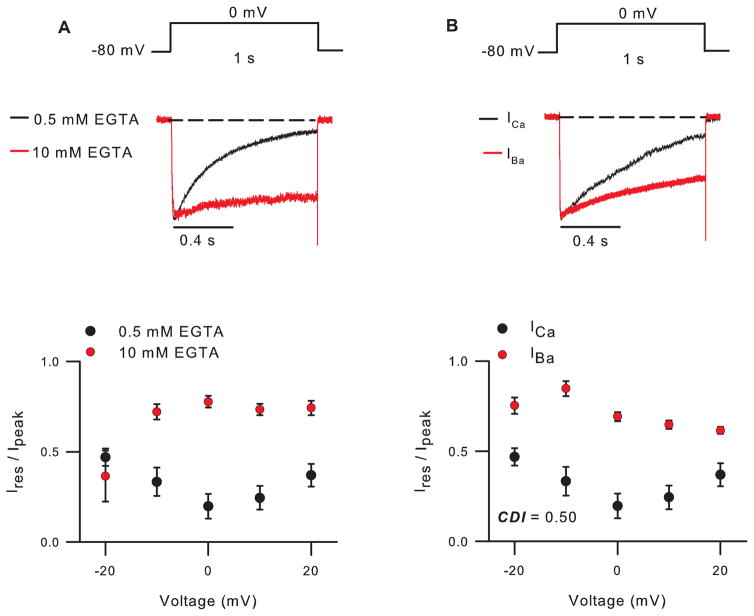
Figure 1. CDI of Cav2.2 channels.
A,B) Top, Voltage protocols and representative current traces. Currents were leak-subtracted using the P/4 method. Bottom, Ires/Ipeak represents residual current amplitude at the end of the pulse normalized to the peak current amplitude, and is plotted against test voltage. In A, internal recording solution contained 0.5 mM or 10 mM EGTA. In B, internal recording solution contained 0.5 mM and extracellular solution contained 10 mM Ca2+ (ICa ) or Ba2+ (IBa ). CDI = Ires/Ipeak for IBa - Ires/Ipeak for ICa, where Ires/Ipeak for IBa = 0.69 ± 0.02 and ICa = 0.19 ± 0.07 for test pulse to 0 mV. Currents and averaged data for ICa (n=10) and IBa (n=8) are from different cells.

