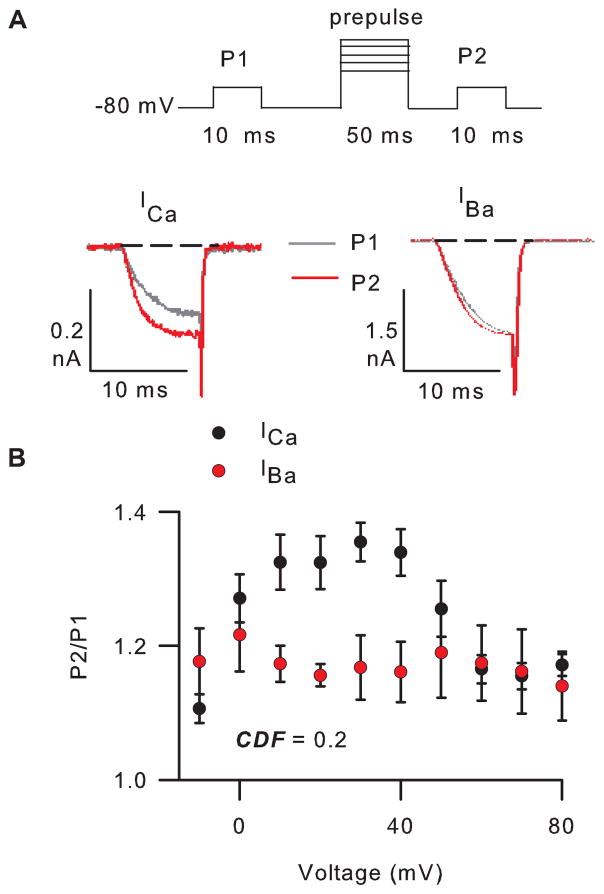
Figure 2. CDF of Cav2.1 channels.
A) Top, voltage protocol and representative ICa and IBa evoked by 10-ms test pulses to 0 mV and -10 mV, respectively, before (grey) and after (red) a 50-ms prepulse to +30 mV. Currents were leak-subtracted using the P/4 method. B) The ratio of P2/P1 current amplitudes is plotted against prepulse voltage. CDF = the difference in P2/P1 for ICa and IBa using a +30-mV prepulse, where P2/P1 for ICa =1.4 ± 0.03 (n=4) and for IBa =1.2 ± 0.05 (n=4) for a +30-mV prepulse. Currents were recorded in 10 mM extracellular Ca2+ or Ba2+ and 10 mM intracellular EGTA. Currents and averaged data for ICa and IBa are from different cells.

