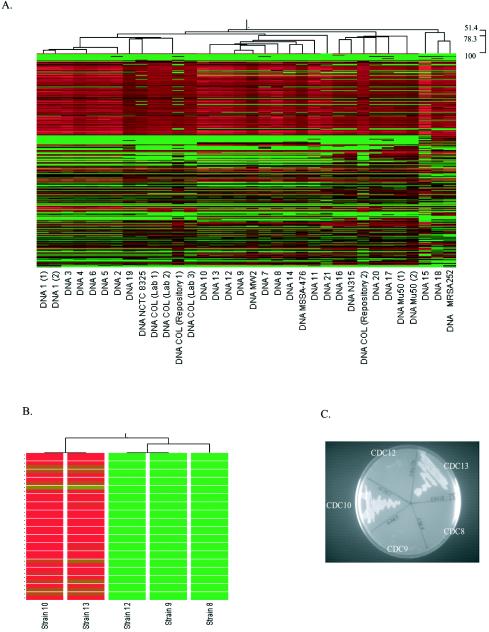
FIG. 3.
GeneChip-based genotyping. (A) Saur2a-derived dendrogram (top) with heat map (beneath) for all qualifiers that were analyzed in each strain. The dendrogram illustrates the relatedness of each strain based on the signal intensity of each qualifier across all strains. Within the heat map, each qualifier (total, 7,723) is shown vertically for each strain. Red indicates a high signal intensity; green indicates a low signal intensity. The order of qualifiers is identical for all strains. Scanning horizontally identifies qualifiers that have high signal intensity (red) in some strains but low intensities (green) in others. (B) Dendrogram of CDC strains 10, 13, 12, 9, and 8, which were all considered to be identical strains by both ribotyping and PFGE. The heat map illustrates 36 qualifiers (horizontally) that are considered present in strains 10 and 13 but absent in other strains, based on adjusted call determinations. (C) Growth characteristics of CDC strains 10, 13, 12, 9, and 8 on kanamycin-containing agar plates.

