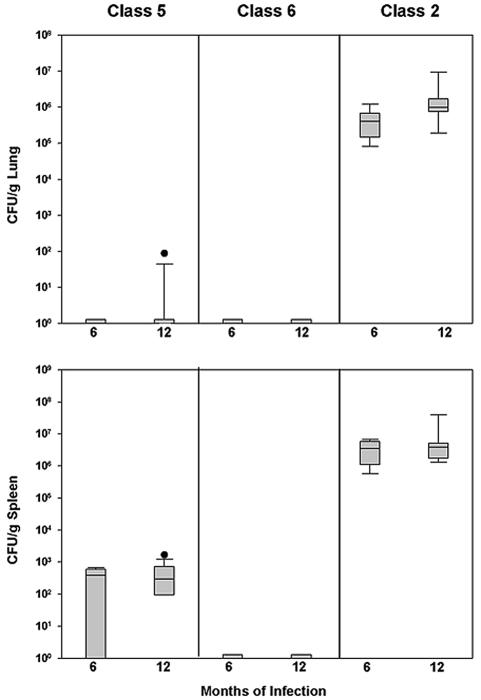
FIG. 4.
Fungal burden following infection with 50 yeast cells. Each box represents the 25th and 75th percentiles, and the bars represent the 10th and 90th percentiles. Blocks at the bottom of the graph without bars represent groups where there were no positive cultures. Circles denote outliers outside the 90th percentile. Differences in both tissues were statistically significant (P < 0.001).

