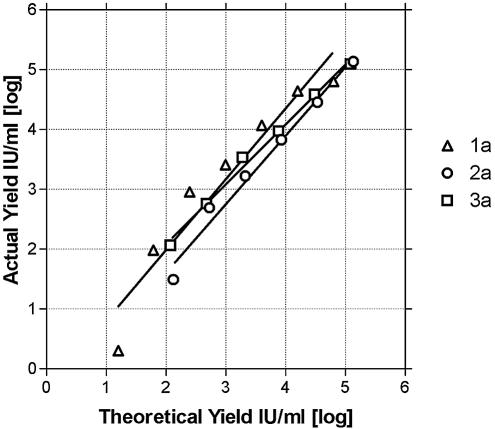
FIG. 3.
Linearity of yield with RNA dilutions isolated from genotype 1a, 2a, and 3a samples. A sample from each genotype was serially diluted, extracted using the MagNA Pure LC instrument, and subjected to real-time RT-PCR. Shown is the theoretical quantity based on the dilution factor (x axis) versus the actual real-time RT-PCR result from each dilution (y axis).

