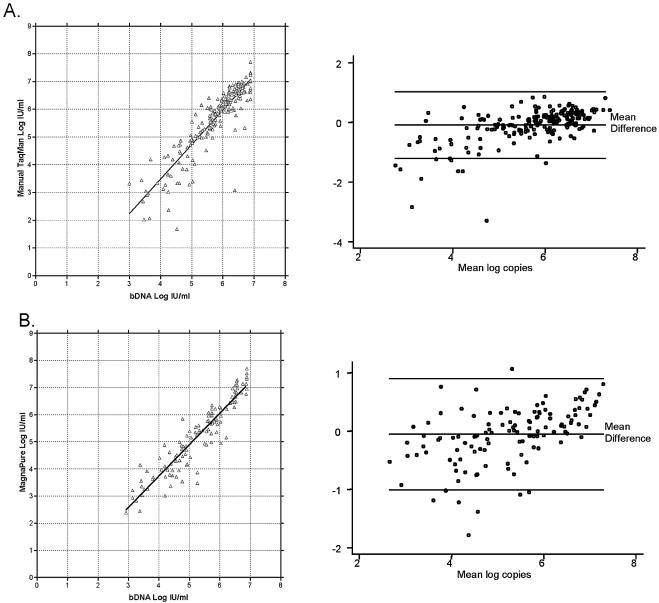
FIG. 4.
Comparison of quantitation of HCV RNA in clinical specimens by real-time RT-PCR versus bDNA. (A) A total of 199 clinical specimens previously found to be HCV positive by bDNA were subjected to manual QIAGEN RNA extraction followed by real-time RT-PCR. Shown in the left panel is the comparison of the viral quantitation by each method. The right panel is an agreement plot, with the x axis representing the quantity of virus by RT-PCR and the y axis representing the difference in quantity by the two methods [(log copy by RT-PCR) − (log copy by bDNA)]. Reference lines represent the mean difference and 95% agreement limits. (B) A total of 124 clinical specimens previously found to be HCV positive by bDNA were subjected to automated RNA extraction using the MagNA Pure LC instrument, followed by real-time RT-PCR. Shown in the left panel is a comparison of the viral quantitation by each method. The right panel is an agreement plot, with the x axis representing the quantity of virus by RT-PCR and the y axis representing the difference in quantity by the two methods [(log copy by RT-PCR) − (log copy by bDNA)]. Reference lines represent the mean difference and 95% agreement limits.

