FIG. 4.
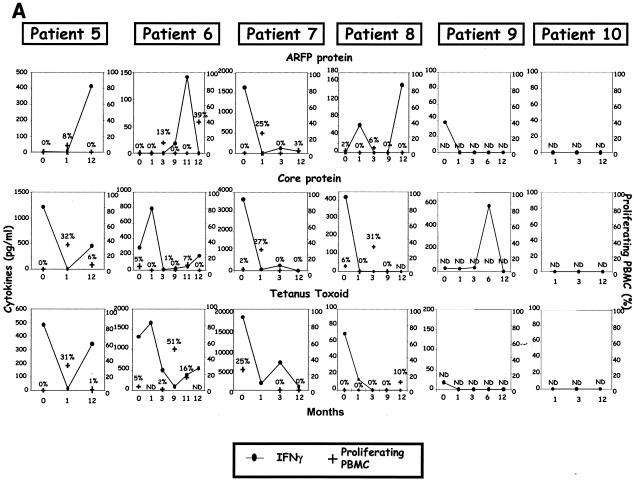
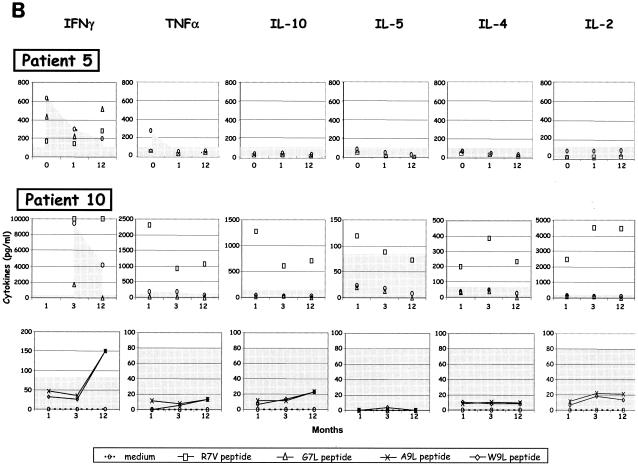
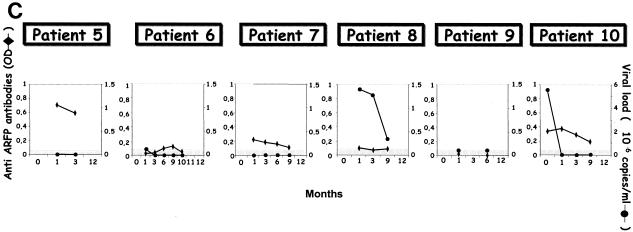
Evolution of core- and ARFP-specific cytokine profiles, T-cell proliferation, Abs, and viremia in chronic HCV patients receiving therapy. Immune and virologic readouts were analyzed for six chronically infected HCV patients (patients 5 to 10) from the time of therapy onset (T0) up to month 12 (M12) following therapy initiation. Patient 5 received only a 6-month course of therapy while all others received a 12-month course. (A) Six cytokines were measured (CBA test) in the supernatants of peripheral blood cells after in vitro stimulation with the G97A peptide, core antigen, or TT. Only cytokines produced at significant levels after antigen stimulation (sensitivity threshold, >80 pg/ml) are represented on the graph (left hand axis). T-cell proliferation, measured by flow cytometry after a 6-day incubation in the presence of CFSE, is reported as the percentage of proliferating T cells (right hand axis) and is represented by bold black crosses. (B) For patients 5 (HLA.A25, HLA.A69, and HLA.B51) and 10 (HLA.A2, HLA.A29, HLA.B7, and HLA.B51), cytokines produced in the supernatant of PBMC stimulated with the corresponding predicted 9-mer peptides were measured with the Th1/Th2 CBA kit. (C) Evolution of anti-ARFP Abs measured by ELISA (OD values are shown on the left hand axis) is reported along with the viremia levels (right hand axis) during antiviral therapy.


